 |
| Fig. 1 Arctic (Tide-gauge) |
Today's post extends one of the longest Dredd Blog series (On Thermal Expansion & Thermal Contraction, 2, 3, 4, 5, 6, 7, 8, 9, 10, 11, 12, 13, 14, 15, 16, 17, 18, 19, 20, 21, 22, 23, 24, 25, 26, 27, 28, 29, 30, 31, 32, 33, 34, 35, 36, 37, 38, 39, 40, 41, 42, 43, 44, 45).
One of the reasons for this is that one of the longest lasting myths of oceanography is the notion that "thermal expansion is the main cause of sea level rise", and the other equally mythical version "thermal expansion is a main cause of sea level rise".
You will find this mythology in articles and papers less often than in the past, but it does persist:
 |
| Fig. 2 Atlantic (Tide-gauge) |
"The two major causes of global sea level rise are thermal expansion caused by warming of the ocean (since water expands as it warms) and increased melting of land-based ice..." (NOAA, emphasis added).
"'thermal expansion' of the ocean has contributed about half of the ... global mean sea level rise we've seen over the last 25 years" (National Geographic; NASA).
This is why I have studied and written so much about it in the previous 45 posts in this series.
Today's graphs compare actual sea level change at tide-gauge stations near seaports with thermal expansion (in the same ocean).
 |
| Fig. 3 Indian (Tide-gauge) |
As you can see, the thermal expansion values are not 'the' or even 'a' major cause of sea level rise in that ocean.
Nor is thermal contraction 'the' or even 'a' major cause of sea level fall there.
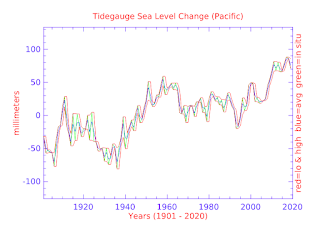 |
| Fig. 4 Pacific (Tide-gauge) |
If they continue to use the falsified hypothesis they will misinform students and interested researchers who will perpetuate the myth even longer.
One of the things I have done is to show exactly what values and computations I use in order to calculate the realities of thermosteric dynamics.
 |
| Fig. 5 Southern (Tide-gauge) |
The ocean is not on a planet bereft of quantum physics, so we should realize that ocean heat is "potential enthalpy"; that potential enthalpy is 'composed' of photons; and that those photons are subject to the laws of thermodynamics and quantum physics.
Thus, the calculations and techniques one uses need to be the best and brightest, but alas that isn't the case in way too many instances.
 |
| Fig. 6 Arctic (Thermosteric) |
Consider four examples: first remember the story of the detective who asked the robber why he robbed banks, to which the robber replied "because that is where the money is."
When I am asked why I do not focus on surface melt in Antarctica and Greenland instead of focusing on the subsurface faces of tidewater glaciers, I reply "because that is where the most melt is."
Second, remember that we are well past the time to begin using TEOS-10 calculations in seawater research.
It became official circa 2010 so it has been a decade since the EOS-80 standard went out of play (TEOS-10).
 |
| Fig. 7 Atlantic (Thermosteric) |
Third, thermal expansion is not the only thermal effect on seawater density, no, it is accompanied by thermal contraction, which causes the sea level to fall (decrease in density).
The graphs at Fig. 6 - Fig. 10 indicate that even the averages of thermosteric sea level changes via both increase and decrease (so, honesty is the use of net values).
They never seem to mention the decrease (thermal contraction) in thermosteric oriented papers, so check out "Sizemograph" graphs of thermal expansion and contraction at 33 depth levels for a photon-level picture of thermal volatility (Quantum Oceanography - 15).
And fourth, the proper calculation must be applied to a fixed mass of seawater, which, according to a peer reviewed paper, is not always the case:
 |
| Fig. 8 Indian (Thermosteric) |
"A common practice in sea level research is to analyze separately the variability of the steric and mass components of sea level. However, there are conceptual and practical issues that have sometimes been misinterpreted, leading to erroneous and contradictory conclusions on regional sea level variability. The crucial point to be noted is that the steric component does not account for volume changes but does for volume changes per mass unit (i.e., density changes). This indicates that the steric component only represents actual volume changes when the mass of the considered water body remains constant."
(In Search Of Ocean Heat - 8). Accuracy and consistency are required in order to remove noise from the signal.
Compare Fig.1 with Fig. 6, Fig. 2 with Fig. 7, Fig. 3 with Fig. 8, Fig. 4 with Fig. 9, and Fig. 5 with Fig. 10.
 |
| Fig. 9 Pacific (Thermosteric) |
There is no pattern-match, no nexus between the variation of the sea level and the variation of the thermal expansion and contraction.
That is because thermal expansion and contraction are not major factors in either sea level rise or sea level fall.
The patterns of TEOS-10 Conservative Temperature (CT), Potential Enthalpy (ho), and moles (mols) of photons match when calculated properly, however, they are not factors in the pattern of graphs of sea level change as measured by tide-gauges around the world (In Search Of Ocean Heat - 8).
 |
| Fig. 10 Southern (Thermosteric) |
One has to wonder when those who are adhering to the thermal expansion myth will get with the picture as many scientists and other researchers already have (The Way of Civilizations - 2).
There are a lot of publications which now say that thermal expansion is not a major cause of sea level change.
Sea level varies very differently from place to place as has been shown, for example, in various seaports series (Seaports With Sea Level Change, 2, 3, 4, 5, 6, 7, 8, 9, 10, 11, 12, 13, 14, 15, 16, 17, 18, 19; The Extinction of Robust Sea Ports, 2, 3, 4, 5, 6, 7, 8, 9, 10, 11, 12, 13).
In the video below Dr. Eric Rignot explains the importance of 'watching' tidewater glaciers in Antarctica and Greenland.
The next post in this series is here, the previous post in this series is here.
No comments:
Post a Comment