Friday, October 28, 2016

Uplifting Myths

Fig. 1 Indian Ocean
"Uplift is the process by which the earth's surface slowly rises either due to increasing upward force applied from below or decreasing downward force (weight) from above" (Uplift).

Fig. 2 Southeast Alaska
Some scientists use the term promiscuously in a manner, whether intended or not, that is akin to politicians who use "dog whistles" to send messages to a targeted audience:
Dog whistle is a type of strategy of communication that sends a message that the general population will take a certain meaning from, but a certain group that is "in the know" will take away the secret, intended message. Often involves code words.
(Urban Dictionary, "dog whistle", cf. AGU).  In that sense, "uplift," like "thermal expansion," is a "dog whistle."

This use of isostasy promiscuously has been spread far and wide for decades by the Oil-Qaeda funded disinformation apparatus (Smoke & Fumes).

It is used in a certain way in sea level change (SLC) discussions to gloss over the reality presented by massive quantities of evidence from scientific observation and measurement.
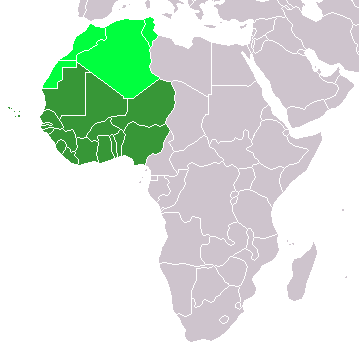
Fig. 3 West Africa
I have criticized the improper use of uplift / isostatic application to SLC scenarios for a long time, because like satellite use for gathering SLC evidence, it is relatively new (GPS history).

Remember that the "S" in "GPS" means satellite.

It is not an exaggeration to say that satellite usage has had some advances as well as some set backs in the effort to study uplift as it applies to SLC.

So, sometimes "uplift models" are used in place of measured and observed values:
The correction for glacial isostatic adjustment (GIA) accounts for the fact that the ocean basins are getting slightly larger since the end of the last glacial cycle. GIA is not caused by current glacier melt, but by the rebound of the Earth from the several kilometer thick ice sheets that covered much of North America and Europe around 20,000 years ago. Mantle material is still moving from under the oceans into previously glaciated regions on land. The effect is that currently some land surfaces are rising and some ocean bottoms are falling relative to the center of the Earth (the center of the reference frame of the satellite altimeter). Averaged over the global ocean surface, the mean rate of sea level change due to GIA is independently estimated from models ... The magnitude of this correction is small (smaller than the ±0.4 mm/yr uncertainty of the estimated GMSL rate) ...
(What is GIA, emphasis added). In that article they do not give measurements such as those stored in the World Ocean Database (WOD) or the Permanent Service for Mean Sea Level (PSMSL) database.

Nor do they seem to be in touch with the growing awareness that ice sheet gravity loss goes hand and glove with ice sheet mass loss, which goes hand in glove with SLC  (Sea level fingerprints, Cryosphere, PDF; The Gravity of Sea Level Change, 2, 3, 4; Proof of Concept , 2, 3, 4, 5, 6, 7, 8).

I quote one of the movers and shakers quite often, because he has a firm grasp of the entire subject matter:
Fame of the academic variety came early to Mitrovica and mushroomed about a decade ago, when he reminded people what happens to local sea levels in the vicinity of a melting ice sheet, like those covering Greenland and Antarctica. The effect was first described a hundred years ago, but “people had forgotten how big it was,” he says. “It’s big.” If Greenland’s ice sheet melted entirely, sea level would fall 20 to 50 meters at the adjacent coast. That’s counterintuitive, but the ice sheets are so massive (Greenland’s ice, one-tenth the size of the Antarctic ice sheets, weighs on the order of 3,000 trillion tons) that two immediate effects come into play. First, all that ice exerts gravitational pull on the surrounding ocean. When an ice sheet melts, that gravitational influence diminishes, and water moves away from the ice sheet, causing sea levels to drop as far as 2,000 kilometers away. (The drop is most pronounced close to the glacier, because gravity’s effects dissipate with distance.) But because the sea level has fallen where the ice sheet melted, it rises everywhere else beyond that 2,000-kilometer boundary, and on distant shores this rise is far greater than the global average. The effect amplifies the rise in average global sea level attributable to the addition of the meltwater itself to the oceans. (Greenland alone contributed a trillion tons of melted ice from 2011 to 2014.) Second, the land beneath the now-vanished ice sheet slowly rebounds, rising as the weight of the mass above diminishes, a process that continues for thousands of years after the ice sheet is gone.
(Harvard Magazine, emphasis added). These quotes and links sum up the large and small of the dynamics of SLC, as well as the fast and the slow of SLC.

What that adds up to is that the dog whistles "thermal expansion" and "uplift" need to be brought back to the reality depicted by the abundant evidence now available.

Anyway, let me move on and demonstrate why much of the "uplift hypothesis" is falsified, in its current dog whistle form, by discussing it in the context of the evidence (or lack thereof).

As regular readers know, we have recently taken a look at ocean dynamics near West Africa and the Indian Ocean (Questionable "Scientific" Papers - 11, On the West Side of Zero - 2).

Less recently we have taken a look at Southeastern Alaska (Proof of Concept - 3).

Notice Fig. 1, (which graphs areas of the Indian Ocean), Fig. 2, (which graphs areas of Southeastern Alaska), and Fig. 3, (which graphs West Africa).

Note that I added the comparatively short satellite record (the red line beginning in the year 1993) of global mean sea level (GMSL) to these graphs, adapted to the PSMSL RLR of the zone (I acquired the satellite data from NASA).

The trend line on Fig. 1 shows upward and downward movements, which is typical of tide gauge records at specific tide gauge stations around the world.

These trends are not primarily caused by uplift or thermal expansion (the minor players, the "small" in the GIA link above), rather they are primarily caused by displacement and ghost-water (the It’s big that professor Mitrovica mentioned in the Harvard Mag. quote above).

All of the locations in those three graphs have abrupt trend changes in relatively short time frames that are too short for the Earth's crust to be fostering.

Thermal expansion and uplift are "dog whistles" when misused by the warming commentariat in a degenerating society:
Former New York City Mayor Mike Bloomberg attempted to explain the sentiment of Donald Trump’s supporters, noting that many would be “flipping hamburgers” after they lose their jobs to technology.

“One thing that has to be said here is Donald Trump really does represent 40% to 45% of this country. They are petrified of their future. Their next job once they get laid off is going to be flipping hamburgers. They’re going to live until 85 and their Social Security is not enough to live on and they’re being forced out of their jobs in their fifties or whatever,” the multi-billionaire media and technology magnate said at Bloomberg’s “The Year Ahead” conference in New York on Tuesday.

He acknowledged that technology, not global trade, is destroying an enormous number of jobs. Indeed, this explains why manufacturing activity is up even as manufacturing jobs falter. This is a problem that affects the constituents of both political parties.
(Blomberg News). In times when the public is preoccupied with social survival, various mental dynamics can take the focus off of the warming commentariat to the point that it degenerates too (Etiology of Social Dementia, 2, 3, 4, 5, 6, 7, 8, 9, 10, 11, 12, 13, 14; Agnotology: The Surge, 2, 3, 4, 5, 6, 7, 8, 9, 10, 11, 12, 13, 14, 15, 16, 17).

Not only do we have "to serve somebody," but we also have to trust somebody (The Pillars of Knowledge: Faith and Trust?) ... unless we put on our lab coats (Put Your Lab Coats On).


Thursday, October 27, 2016

Choose Your Trances Carefully - 7

"Trump will help us stop Bad Barbara"
I. A Peek At Trances

This series has bolstered the subcultural notion that there is no reason to think that officialdom can avoid its ingrained systemic trances (Choose Your Trances Carefully, 2, 3, 4, 5, 6).

These trances even form the basic cultural cognition playing out before our eyes in the climate of media misinformation storms:
"While America and the world have been making strides to deal with climate change, so far the efforts are halting and pitifully inadequate.

Most people instinctively resist conclusions like this. It sounds extreme, which is generally an indicator of wrongness. But sometimes extreme problems require extreme solutions. A failure to appreciate the radical implications of climate change is a political error of the first order."
(The Week, emphasis added). Those seeking to be elected do pretzel positions trying to avoid the more serious predicaments facing those they claim to want to make "secure" (The Elections of Pontius Pilots, 2, 3, 4, 5).

II. Peak Trances Don't Prevent Reality

Yet, the bleep goes on in the mindless trances of Bullshitistan (Media Was Right to Ignore Climate Change in Debates).

Meanwhile, more and more subsystems within the Global Climate System show signs of further degradation:
"When the vortex weakens, a growing number of climate scientists argue, the cold Arctic air migrates to lower latitudes, as happened in early 2014 and 2015. The sudden and somewhat prolonged burst of cold broke pipes and water mains and more than doubled energy bills in places like New York and New England as it wreaked havoc across a wide swath of the country.

The movement of the vortex has come as the Arctic steadily loses sea ice, a process that some scientists are worried could accelerate in the future as the Earth continues to warm at record levels."
(Scientific American). I have written about this vortex upon occasion for a couple of years now (The Damaged Global Climate System, On The Origin of Tornadoes - 6).

Not only is the ocean taking fatal hits, the atmosphere is being choked to death with new methods of madness:
"A weird phenomenon is happening high above the Tibetan Plateau and the Himalayas that could prove to be an atmospheric nightmare. Pollutants that gather from India and China in the lowlands around the mountains can be boosted as high as 18 kilometers, reaching the stratosphere—the atmospheric layer directly above the troposphere that contains most of Earth’s ozone. That is far higher than aerosols from vehicles, power plants and fires usually reach. Once aerosols are that high they can spread globally, destroy the ozone layer that protects us from ultraviolet radiation and exacerbate global warming, researchers warn.

Until a few years ago “we thought human activities had little impact on the stratosphere,” says Jean-Paul Vernier, a remote-sensing expert at the NASA Langley Research Center. Scientists had previously thought only volcanoes could eject aerosols—tiny particles or droplets—to such heights. And most models looking at future climate change scenarios did not account for aerosols in the stratosphere. Special tests reported in September confirm the aerosols continue to collect over India, and the work reveals fresh insights into their composition."
(Strange Pumping Effect above Asia Threatens the Ozone Layer, emphasis added). Oh, that would be the "worse than previously thought" trance.

III. The Senate Committee on Several Trances

Senator Inhofe will have some more snowballs to prophesy with this winter (Inhofe, Beavis, & Butthead Need Waders, Inhofe's One Man Troofiness Crusade).

But more and more people are noticing that his denial has no impact on reality (The Donald University vs. The Lord GOP University).

IV. Conclusion

Only very strange politicians make a career out of ignorantly seeking policies that bring catastrophe upon innocent people of the world (Agnotology: The Surge, 2, 3, 4, 5, 6, 7, 8, 9, 10, 11, 12, 13, 14, 15, 16, 17).

The next post in this series is here, the previous post of this series is here.

"Don't stop thinking about tomorrow ..."


Tuesday, October 25, 2016

On the West Side of Zero - 2

Fig. 1 The SLC picture @ W. Africa
I completed the rewriting of the PSMSL data handlers.

Those are the software modules that were lost when the errant operating system's installation/upgrade program trashed them some time back.

Fig. 2 Geographical contributors
These modules contain logic to not only calculate sea level change (SLC) from PSMSL data (Fig. 1), they also calculate both the geophysical and geographical components of that SLC.

Fig. 3 Geophysical dynamics
The geophysical components are "displacement," "ghost-water," and "thermal, etc." (Fig. 3).

"Displacement" describes melt water or icebergs entering the ocean from ice sheets or glaciers on land masses.

"Ghost-water" describes the movement of ocean water that has been pulled close to a land mass (by the ice mass gravity - then released as the ice mass gravity diminishes along with the ice), then released and relocated toward the equator (not unlike lunar gravity tides).

Fig. 4 Ocean water temperatures
The geographical components are "Antarctica," "Greenland," and land "Glaciers" - in other words the geographical locations that instigated the SLC in question (Fig. 2).

The area I chose to use in today's post is West Africa (Fig. 6), where nations such as Ghana, Togo, and Mauritania are currently being plagued with damaging SLC.

Fig. 5 Where the action is
To the chagrin of those who hypothesize that thermal expansion is the "major" cause of SLC (Questionable "Scientific" Papers - 11), I also included a graph made from WOD data showing that thermal expansion does not play a major part in the SLC taking place in the subject area (compare Fig. 4 with Fig. 1 and Fig. 3).

The graph at Fig. 3 shows the separate contributions of "Displacement," "Ghost-water," and "Thermal, etc." (clearly indicating once again that "Thermal, etc." is the minor, not the major player in SLC).

The graph at Fig. 2 shows us that up until now Greenland has been the major geographical influence on the SLC taking place in the W. African locations we are focusing on in this post (Fig. 5).

Foreign Policy magazine has recently published an article that describes the damaging action taking place in that area:
"The tide is just starting to come in when David Buabasah begins nervously checking the waters creeping up the coastline toward his partially destroyed home.

As the high tide mounts the steep shore of this small Ghanaian fishing village perched on a shrinking peninsula between the Atlantic Ocean and the Volta River estuary, he and other inhabitants prepare for the worst.

Fig. 6 West Africa (dark green)
“When the big waves come, they can easily kill you. Last week, the ocean took away part of my house while my family was sleeping inside,” says the 32-year-old fisherman, gesturing toward a crumbling brick wall and a pair of door frames, the only remains of his family’s compound.


Growing stronger by the minute, the tide begins to push wave after wave into the village, pounding the dilapidated dwellings with unrepentant force. House walls collapse under the fury of the ocean, and huge pools of saltwater fill the center of town. Those whose houses are the closest to the shoreline can only watch as the waves carry away all of their belongings.

Twenty years ago, Fuvemeh was a thriving community of 2,500 people, supported by fishing and coconut plantations that are now completely underwater. But in the past two decades, climate change and industrial activity — such as sand mining and the construction of dams and deep-sea ports, which trap sediments and prevent them from reaching the coastline — have accelerated coastal erosion here. Gradually but inexorably, the ocean has swallowed up hundreds of feet of coastline, drowning the coconut plantations and eventually sweeping away houses."
(West Africa SLC). One statement in the quote ("Twenty years ago, Fuvemeh was a thriving community") is given higher significance, especially if you look at the SLC taking place there 20 yrs. ago (~1996).

In the area we are focusing on in today's post, an abrupt sea level fall trend began to take place circa 1980 (Fig. 1).

That trend lasted until it bottomed out circa 1986, at which time a steep sea level rise trend began.

During that sea level fall era people naturally built structures closer and closer to the receding ocean (a la Miami Beach, FL).

Eventually the sea level fall trend turned back on them, beginning circa 1987.

It established and now perpetuates the current upward trend which is causing the problems that will be seen more and more as time goes on its SLC way.

This is the same problem that plagues the east coast of the U.S.eh? (e.g. The Extinction of Chesapeake Bay Islands).

This SLC factor, since it is global, gives new meaning to "we are the world."

The previous post in this series is here.

"we are saving our own lives" ... take heed Humble Oil-Qaeda.