 |
| Phoenician vessel |
I. An Ocean of Questions
Will the seaports of our current civilization go the way of those of ancient Phoenicia and Tyre?
If so, it will be caused by a power that, in the first place, gave them the place to prosper:
"The prosperity of Phoenician cities such as Tyre, Sidon, and Byblos was based on trade, and it was the search for new commodities and new markets which resulted in the Phoenicians branching out from the narrow coastal strip of the Levant and colonizing territories throughout the ancient Mediterranean from the 10th century BCE. Some of these colonies, like Leptis Magna, Cadiz, and Palermo, became important cities in their own right, and none more so than Carthage on the north coast of Africa, which would eventually outshine its mother city of Tyre and create an empire of its own."(Ancient History Encyclopedia). That power was and still is the vast ocean upon which sea trade emerges and prospers by way of seaports.
II. Measuring Ocean Changes At Seaports
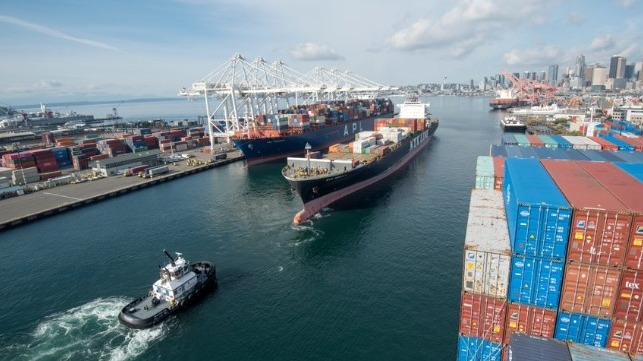 |
| Modern Seaport Vulnerability |
The reason for the software module change was: 1) previously the graphs were generated by a separate software module from the module that generated the HTML files, 2) which resulted in graphs that did not have a zone-based granularity, 3) which was due to the fact that the graphs were averages of multiple WOD Zones in a particular Coastal Id type, and 4) that in effect made the graph files too unrelated to the HTML files.
Since the graphs were Coast Id specific rather than Zone specific, the sea level numbers on the graphs were not easy to confirm by simply matching the HTML values with the graph values.
The graphs were designed to give a general idea of the trend of sea level impacts to seaports (not to confirm the HTML file data).
So, now both the HTML and the graph files are single-zone specific, and both are alphabetized by country name.
Matching ports and sea level changes to the Zone in which that port is located is now simplified.
The numbers on the graphs and the HTML files should match reasonably well now.
III. Using The Seaport & Sea Level Data
Data analysis is a matter of simply looking at the HTML and graph data which contain: 1) a list of seaports in the WOD Zone, 2) links to websites that have information about those ports, 3) a list of Tide Gauge Stations in the WOD Zone, 4) links to PSMSL data about each Tide Gauge Station in that zone, 5) information about the duration, scope, and scale of the sea level changes, 6) a discussion of the Cryosphere influences on those sea level changes, 7) links to discussions of land surface sinking/rising, 8) a graph of the PSMSL RLR sea levels in "RLR millimeters", 9) a graph of the exact millimeter sea level changes in that zone, and 10) the Coast Id (or Ids in cases of countries with multiple Coast types).
It takes 24 appendices to organize and present the data as described.
The menu into these 24 appendices is composed of the following HTML table:
| Single Coastline Countries | Multi Coastline Countries | Single Coastline Graphs | Multi Coastline Graphs |
| Appendix: A-C | Appendix: A-C | Appendix: A-C | Appendix: A-C |
| Appendix: D-G | Appendix: D-G | Appendix: D-G | Appendix: D-G |
| Appendix: H-L | Appendix: H-L | Appendix: H-L | Appendix: H-L |
| Appendix: M-O | Appendix: M-O | Appendix: M-O | Appendix: M-O |
| Appendix: P-T | Appendix: P-T | Appendix: P-T | Appendix: P-T |
| Appendix: U-Z | Appendix: U-Z | Appendix: U-Z | Appendix: U-Z |
This format will be used from now on here at Dredd Blog because it is much easier to compare the graph appendices with the HTML appendices.
IV. Closing Comments
Some you new Dredd Blog readers may be perplexed by the sea level change graphs that show both sea level rise and sea level fall, depending on the geographical location (zone) of the port and tide gauge stations.
That perplexity is likely due to the bathtub model oceanography of the past that has misinformed the public as to the true nature of sea level change (The Bathtub Model Doesn't Hold Water, 2, 3, 4, 5).
A previous series here on Dredd Blog discussed a Coast Id area where there is both sea level fall and sea level rise, and the scientific factual reasons for it (Proof of Concept, 2, 3, 4, 5, 6, 7, 8, 9, 10).
There is no question about it (NASA Busts The Ghost).
This series is another "grey literature" public service of Dredd Blog.
The next post in this series is here, the previous post in this series is here.
No comments:
Post a Comment