 |
| Fig. 1 "Golden Zones" |
I. Paper Trails
In interesting papers (cited often by
Dr. Mitrovica) a scientist suggests a way to
select a number of tide gauge station records to determine reasonable sea level change results
in terms of a global average.
Those papers are cited as
Douglas, B. C. 1991, "
Global sea level rise, Journal of Geophysical Research 96:6, 981–6, 992"; and
Douglas, B. C. 2008, "
Concerning evidence for fingerprints of glacial melting, Journal of Coastal Research 24:218 – 227".
Those 21 or so tide gauge locations ostensibly render a record that more accurately reflects sea level change over a widespread ocean area.
II. Purpose Beats Numbers
Dr. Mitrovica and others no longer use such a small number of tide gauge stations, rather, hundreds are selected because of, among other things, the
rampant skepticism caused by oil industry propaganda (
Merchants of Doubt,
Smoke & Fumes).
 |
| Fig. 3a |
 |
| Fig. 3b |
At times I use over a thousand tide gauge station records (
The Warming Science Commentariat - 4).
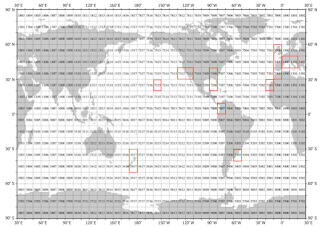
At other times I use what I consider to be a better way of localizing sea level change issues, which is a variable number of tide gauge stations within particular WOD Zones (e.g.
Golden 23 Zones Meet TEOS-10).
WOD zones are small enough in terms of latitude and longitude to give a local perspective (
Fig. 1).
After all, local focus is better suited to solving local issues than a less revealing global perspective is.
The
global average is not useful to those who want to plan for
their local area experience simply because their own local experience will generally be a different sea level change experience compared to other local areas.
III. Location, Location, Location
An example of how different the experience can be is illustrated by the experience of local communities in Southeast Alaska near Glacier Bay National Park.
 |
| Fig. 4a |
 |
| Fig. 4b |
 |
| Fig. 4c |
Skagway, AK, near Glacier Bay, has a different experience than that of Ketchikan, AK or just south of Ketchikan at Prince Rupert, BC (
Proof of Concept - 3).
Skagway has a local experience of
sea level fall, while Prince Rupert has a
sea level rise experience.
Obviously, city planners of Skagway can't use the same infrastructure planning to deal with sea level change as city planners in Prince Rupert (
Peak Sea Level - 2,
The Evolution and Migration of Sea Level Hinge Points).
IV. Zone In On Fingerprints
One advantage of using WOD Zones (small geographical area) as a beginning location is that tide gauge station data is usually available from the
PSMSL database for just about every coastal area zone.
 |
| Fig. 5 |
As an illustration, the graphs in this series are being used as an experimental exercise to see if the fingerprints of a zone will give any indication as to how ice sheets are impacting that zone.
That knowledge can help, because the dominant ice sheet (the one causing the most sea level change) can be watched for a heads up as to what is coming, and what needs to be considered for infrastructure planning.
The exercise is to fingerprint ice sheets or glacial fields that are having an impact in that zone so infrastructure plans can be a coherent response.
V. Fine Tuning
Following that, if need be, local planners can remove some station data of stations in the subject zone that are at the greatest distances from their location to see if that improves the picture.
 |
| Fig. 6a |
 |
| Fig. 6b |
 |
| Fig. 6c |
In other words, first get the feel of the entire zone's characteristics, then narrow it down to a smaller area within the zone
when that is useful.
The final configuration of tide gauge stations in the zone can be tailored to give a better indication of what can be expected
at the specific locale where relevant infrastructure planning needs to be done.
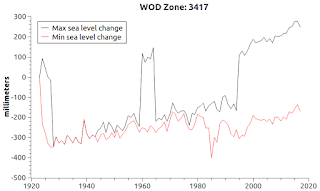
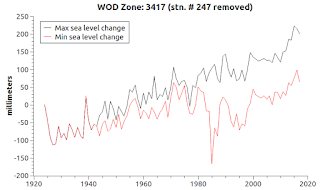
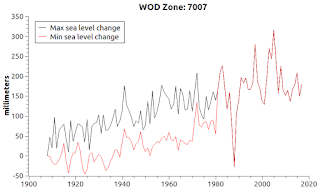
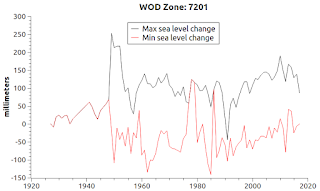
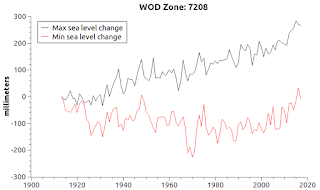
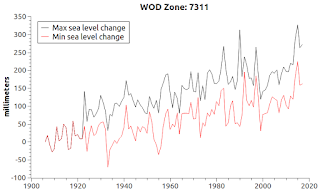
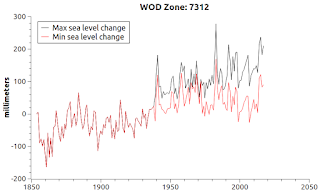
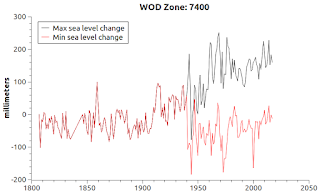
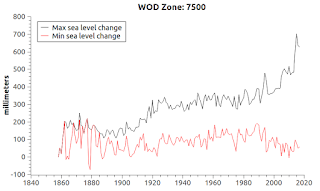
VI. The Experiment's Status
Currently the maximum and minimum values are acquired by processing the qualified stations in a zone by using a simple process.
As each PSMSL tide gauge station's annual RLR value is analyzed, the current low and high values are compared with that value.
If the value is lower, it replaces the zone's current low value with the new low value.
Same with the high value processing.
In the end one gets a picture (a graph fingerprint) of ice sheet impact by comparing the ice sheet fingerprints (
Fig. 2a,
Fig. 2b) with the graph's ups and downs.
 |
| Fig. 7a |
 |
| Fig. 7b |
 |
| Fig. 7c |
 |
| Fig. 7d |
I went over some of that process and analysis in the first three posts of this series (
Build Your Own Sea Level Change Fingerprinting System,
2,
3).
 |
| Fig. 8a |
 |
| Fig. 8b |
VII. Try The Process
Here is the process I use, after generating the graphs, to analyze the graphs to determine how the zone is being impacted by ice sheets.
1) peruse the graphs in each zone for anomalies (such as
Fig. 4b);
2) if there are anomalies, peruse the list of tide gauge stations
in that zone
to see if any of the stations have problematic data;
3) remove that station from the list;
4) regenerate the graph (see
Fig. 4c);
5) compare the graph to the graphs at
Fig. 2a and
Fig. 2b;
6) identify high and low color areas on
Fig. 2a and
Fig. 2b;
7) ascertain which ice sheet is impacting the high line record (black line) and which ice sheet is impacting the low line record (red line).
The ice sheet that is the most distant from the zone is generally the one causing most of the high values (black line).
The ice sheet that is the closest to the zone is generally the one causing most of the low values (red line).
When the zone is equidistant from Greenland and Antarctica, more analysis is required in order to ascertain the greater influence.
The greatest clues come from the color codes on
Fig. 2a and
Fig. 2b, because those are the fingerprints generated as the ice sheets melt.
VIII. Other Considerations
When the zone being analyzed is very close to an area of the Cryosphere that is not an ice sheet, but is significant enough to be a game-changer, the analysis must be specialized.
An example would be a zone close to
Glacier Bay National Park & Preserve (
Proof of Concept - 3) mentioned in
Section III above.
The general impact from being very close to those types of glacial areas is lower lows (red line),
indicating sea level fall, and a lower high values (black line) indicating less of an impact from distant ice sheets.
See
Hot, Warm, & Cold Thermal Facts: Tidewater-Glaciers for a list of some of those locations.
IX. Conclusion
This may seem really complicated, but remember that only one zone needs to be considered by those contemplating sea level change.
By "only one zone" I mean the one where you live; the one where your community has a need to build or improve infrastructure (such as seaports, seawalls, beach houses, coastal roads, and the like).
Here is the list of tide gauge stations in today's post (grouped by zone);
Zone: 7500
station: 5
station: 15
station: 21
station: 66
station: 95
station: 190
station: 202
station: 219
station: 257
station: 286
station: 314
station: 350
station: 361
station: 432
station: 435
station: 755
station: 765
station: 802
station: 861
station: 916
station: 936
station: 939
station: 944
station: 1074
station: 1109
station: 1112
station: 1214
station: 1215
station: 1281
station: 1491
station: 1505
station: 1526
station: 1731
station: 1758
station: 1771
station: 1772
station: 1773
station: 1774
station: 1775
station: 1793
station: 1794
station: 1832
station: 1854
station: 1856
station: 1867
station: 1878
station 2011 excluded [9 yrs. of data]
station 2278 excluded [9 yrs. of data]
station 2279 excluded [7 yrs. of data]
station 2280 excluded [6 yrs. of data]
station 2281 excluded [7 yrs. of data]
station 2282 excluded [7 yrs. of data]
station 2283 excluded [5 yrs. of data]
station 2284 excluded [5 yrs. of data]
station 2285 excluded [3 yrs. of data]
Zone: 7400
station: 1
station: 454
station: 457
station: 459
station: 466
station: 467
station: 469
station: 484
station: 485
station: 561
station: 763
station: 791
station: 1051
station: 1078
station: 1247
station: 1294
station: 1301
station: 1347
station: 1402
station 1482 excluded [8 yrs. of data]
station: 1747
station: 1795
station: 1801
station: 1806
station: 1807
station: 1808
station: 1855
station: 1871
station: 1897
station: 1898
station: 1915
station: 1921
station: 2053
Zone: 7312
station: 10
station: 437
station: 508
station: 1352
station: 1394
station 1663 excluded [4 yrs. of data]
station: 2125
Zone: 7311
station: 158
station: 245
station: 256
station: 377
station: 717
station: 766
station: 795
station 883 excluded [6 yrs. of data]
station: 1013
Zone: 7308
station: 112
station: 246
station: 316
station: 395
station: 716
station: 1136
station: 1156
station 1537 excluded [5 yrs. of data]
station: 1641
station 1670 excluded [2 yrs. of data]
station 1715 excluded [9 yrs. of data]
station: 1884
station: 2215
Zone: 7300
station: 52
station: 162
station: 208
station: 209
station: 488
station: 490
station: 496
station: 498
station 506 excluded [6 yrs. of data]
station: 960
station: 981
station: 985
station: 1336
station: 1425
station: 1455
station: 1456
station: 1460
station: 1809
station: 1810
station: 1813
station: 1883
station: 1940
station: 2047
station 2054 excluded [8 yrs. of data]
station 2055 excluded [8 yrs. of data]
station: 2056
station 2057 excluded [9 yrs. of data]
station: 2058
station 2059 excluded [9 yrs. of data]
station: 2117
Zone: 7215
station: 155
station: 521
station: 756
station: 823
station: 2128
station 2129 excluded [8 yrs. of data]
station 2273 excluded [6 yrs. of data]
Zone: 7208
station: 188
station: 199
station: 270
station: 363
station: 428
station: 520
station: 690
station: 1106
station: 1107
station: 1182
station 1187 excluded [9 yrs. of data]
station: 1193
station: 1297
station: 1424
station: 1638
station 1669 excluded [2 yrs. of data]
station: 1696
station: 1701
station 1714 excluded [9 yrs. of data]
station 1717 excluded [6 yrs. of data]
station: 1909
station: 2123
station 2286 excluded [4 yrs. of data]
station 2289 excluded [5 yrs. of data]
station: 2296
Zone: 7201
station: 303
station: 565
station: 568
station: 585
station 590 excluded [3 yrs. of data]
station: 593
station: 1710
station: 1802
station: 1803
station: 2048
station 2049 excluded [9 yrs. of data]
station 2050 excluded [9 yrs. of data]
station: 2051
station: 2064
station: 2065
station 2066 excluded [9 yrs. of data]
Zone: 7007
station: 163
station: 169
station: 456
station: 581
station: 639
station 1530 excluded [6 yrs. of data]
station 1783 excluded [5 yrs. of data]
Zone: 5305
station: 157
station: 223
station: 431
station: 433
station: 434
station: 764
station: 819
station: 832
station: 857
station: 864
station 897 excluded [3 yrs. of data]
station 1542 excluded [2 yrs. of data]
Zone: 3417
station: 221
station: 247 (earthquake damaged?)
station: 259
station: 500
station: 787
station 993 excluded [4 yrs. of data]
station: 998
station: 1004
station: 1643
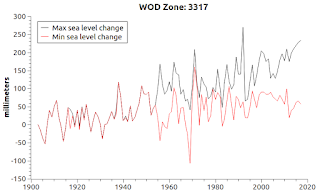
Zone: 3317
station: 150
station: 217
station 978 excluded [5 yrs. of data]
station: 996
station: 1065
station: 1590
station: 1613
station 1621 excluded [5 yrs. of data]
station: 1750
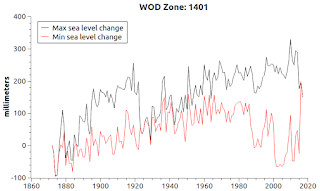
Zone: 1401
station: 39
station: 87
station 100 excluded [4 yrs. of data]
station 101 excluded [7 yrs. of data]
station 103 excluded [6 yrs. of data]
station: 105
station: 106
station: 129
station: 154
station: 168
station: 352
station: 353
station: 685
station: 760
station: 761
station 972 excluded [8 yrs. of data]
station 990 excluded [4 yrs. of data]
station: 1009
station: 1075
station 1262 excluded [3 yrs. of data]
station 1574 excluded [9 yrs. of data]
station 1577 excluded [6 yrs. of data]
station 1578 excluded [6 yrs. of data]
station: 1706
station 1718 excluded [5 yrs. of data]
station: 1817
station: 1859
station 1945 excluded [9 yrs. of data]
station: 2075
station: 2080
station: 2082
station: 2086
station: 2087
station: 2092
station: 2095
station: 2096
station: 2097
station: 2098
station: 2099
station: 2100
station 2144 excluded [9 yrs. of data]
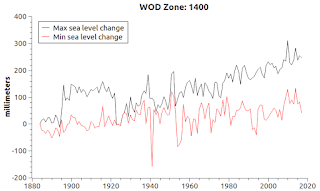
Zone: 1400
station: 59
station: 61
station: 108
station: 109
station: 453
station: 474
station: 788
station: 958
station: 980
station 1383 excluded [9 yrs. of data]
station: 1468
station: 1469
station: 1764
station: 1811
station: 1929
station: 2078
station: 2084
station: 2090


