Wednesday, April 8, 2020

Here Come De Conservative Judges - 8

Alt Righty then ...
"It's going to be a long time going" (Crosby, Stills, &Nash).

This series began on March 16, 2009. and has continued down through Dredd Blog time until now.

The theme of this series has held true but since it deals with things hidden in plain sight, it is usually disregarded.

Things in plain sight for some reason are more difficult for us to discern (e.g.
The Ghost-Water Constant, 2, 3, 4, 5, 6, 7, 8, 9; The Ghost Plumes, 2, 3, 4, 5, 6, 7, 8, 9, 10, 11; The Ghost Photons, 2, 3; How To Identify The Despotic Minority, 2, 3, 4, 5, 6, 7, 8, 9, 10, 11, 12).

The repercussions caused by disregarding the theme presented betimes along this timeline, however, are as easy to discern as a serious heart attack or a feature length shit show (Welcome to the Shit Show!': WI, U.S. Supremes Force Choice Between Suppression or Pandemic: 'BradCast' 4/7/2020).

It is like the scene-change when watching a video speed-up and/or slow down (As time passes by: Observed motion-speed and psychological time during video playback).

It's that past, present, and future thingy ("Scientists have discovered that 'the present' has always existed, but some of them are not sure about 'the past' and 'the future'." -Dredd).

This scene is part of the "DNA" of civilizations, including our own:
"In other words, a society does not ever die 'from natural causes', but always dies from suicide or murder --- and nearly always from the former, as this chapter has shown."
...
"In the Study Toynbee examined the rise and fall of 26 civilizations in the course of human history, and he concluded that they rose by responding successfully to challenges under the leadership of creative minorities composed of elite leaders. Civilizations declined when their leaders stopped responding creatively, and the civilizations then sank owing to the sins of nationalism, militarism, and the tyranny of a despotic minority."
(How To Identify The Despotic Minority). There is the proverb "where there is no vision the people perish" which addresses the notion of "vision" in the sense of being able to conceive of and "feel" what the future will be by analyzing what is or is not being done in the present (The Thursday Thought).

We don't have to "let it all hang out" because we don't have ultimate "let" power ... if we "wait to see what happens".

We have to know the implications of present actions and know what "knowledge" is composed of if we are to say "we have vision" (The Pillars of Knowledge: Faith and Trust?).

The next post in this series is here, the previous post in this series is here.

Ode to the vision of the U.S. gummit (it's their thing) ...


Tuesday, April 7, 2020

Quantum Oceanography - 3

In today's post I want to continue consideration of the benefit of applying quantum physics to a popular topic these days, which is "ocean heat content" (In Search Of Ocean Heat, 2, 3, 4, 5, 6, 7, 8).

The gist of it is that infrared photons make up what oceanographers call "potential enthalpy", which is another way of saying "ocean heat".

Let's review that concept in its most modern form:
"The quest in this work is to derive a variable that is conservative, independent of adiabatic changes in pressure, and whose conservation equation is the oceanic version of the first law of thermodynamics. That is, we seek a variable whose advection and diffusion can be interpreted as the advection and diffusion of ‘heat.’ In other words, we seek to answer the question, ‘what is heat’ in the ocean?
...

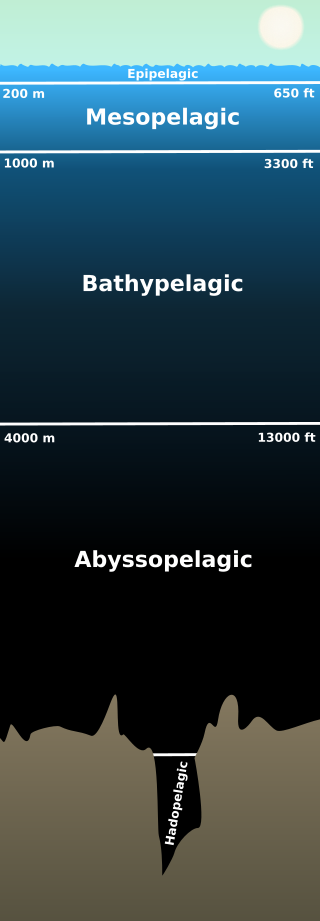
Fig. 2 Pelagic depths
The variable that is currently used for this purpose in ocean models is potential temperature referenced to the sea surface, θ, but it does not accurately represent the conservation of heat because of (i) the variation of specific heat with salinity and (ii) the dependence of the total differential of enthalpy on variations of salinity.
...
For example, an increase in pressure of 107 Pa (1000 dbar), without exchange of heat or salt, causes a change in enthalpy that is equivalent to about 2.5ЊC. We show in this paper that in contrast to enthalpy, potential enthalpy does have the desired properties to embody the meaning of the first law.
...
Present treatment of oceanic heat fluxes is clearly inconsistent. Ocean models treat potential temperature as a conservative variable and calculate the heat flux across oceanic sections using a constant value of heat capacity. By contrast, heat flux through sections of observed data is often calculated using a variable specific heat multiplying the flux of potential temperature per unit area (Bryan 1962; Macdonald et al. 1994; Saunders 1995; Bacon and Fofonoff 1996). Here it is shown that the theoretical justification of this second approach is flawed on three counts. While the errors involved are small, it is clearly less than satisfactory to have conflicting practices in the observational and modeling parts of physical oceanography, particularly as an accurate and convenient solution can be found.
...
it is perfectly valid to talk of potential enthalpy, h0, as the 'heat content' ...”
(In Search Of Ocean Heat, quoting McDougal 2003). That Dredd Blog post which used Dr. McDougal's 2003 published paper, discussed the TEOS-10 functions for deriving the quantity of potential enthalpy in a kilogram of seawater.

I have taken it further in more recent posts, in the sense of identifying the main component of potential enthalpy as photons, the quanta of electromagnetic radiation, at their infrared energy level.

This way of looking at it transcends the limited notions of ocean heat transfer by noting that electromagnetic radiation obeys the laws of thermodynamics in that "hot flows spontaneously to cold", and that photons in such a flow can travel through space ... from atom to atom or molecule to molecule.

Much if not most of the oceanography focusing on ocean heat content does not touch upon the quantum mechanics of photons as a part of the composition of ocean heat content.

Thus, the natural lack of constraint on photon flow is overlooked, so that the ease in which ocean heat can move through seawater isn't adequately considered.

That heat movement is historically attributed to ocean water currents rather than the radiation of photons (spontaneous photon currents).

That historical hang-up may be a factor in the continual "worse than previously thought" statements we see in news reports, which establishment science's overly conservative estimates of glacial melting tend to produce.

In times past I have blogged about the thermal proportions shown in the matching patterns of the TEOS-10 constructs, such as Conservative Temperature and potential enthalpy.

In other words I have hypothesized that they have the same "genes" if you will (meaning they are composed of photon energy).

The graphs in many posts here on Dredd Blog have pointed out those thermodynamic structural patterns (e.g. In Search Of Ocean Heat - 8).

I did those graphs "back in the day" with SciDavis software.

To do that with SciDavis software required four-pane graphs which do not adequately render or expose the intensity of those thermodynamic structural similarities.

So, today I have produced some graphs that really scream out the intensity of the thermodynamic likeness between photons and Conservative Temperature.

To fully do so I had to emulate a kind of "Revised Local Reference (RLR)" like the folks over at the "Permanent Service for Mean Sea Level (PSMSL)" have done.

It is a way to take a close look at things with orders of magnitude of difference and sameness ... by isolating the sameness.

The two appendices today (Appendix A, html tables and Appendix B, graphs) are a step in that direction.

The HTML tables have the actual values of in situ measurements taken from the WOD and SOCCOM, averaged, then placed in my SQL server.

I use the Conservative Temperature (CT) and photon moles column at three depths shown in the HTML tables (Appendix A).

The RLR part of it is to add the CT and photon mol values as follows: 1) the CT values are used as is for the first graph line, 2) since the mol values are small in comparison to the CT values, for the second graph line I add the CT and mol value together (Appendix B) (an example of the 4-pane SciDavis type graph is included at the end of the Appendix B graphs).

The result of the "RLR-like" technique is that the two lines (one CT the other CT+MOL) are only a very small distance apart making it easy to see how closely the "thermodynamic pattern" of the one matches with the other.

This is done for each of the three depths (Epipelagic, Mesopelagic, and Bathypelagic depth levels) that are relevant along the grounding line of Antarctica's Tidewater Glaciers.

The next post in this series is here, the previous post in this series is here.


Appendix A (html)

This is an appendix to: Quantum Oceanography - 3


Fig. 1 Antarctica Sectors A-F and WOD zones

Fig. 2 Antarctica Sectors A-F


Legend:

"CT" = Conservative Temperature
"photons" = infrared spectrum (1.30e-6 m)

"epi" = epipelagic depth (0-200 m)
"meso" = mesopelagic depth (201-1000 m)
"bath" = bathypelagic depth (1001-4000 m)

 "deg.C" = degrees Celsius
"mol/kg" = moles per kilogram

All Antarctica Averages (CT/Photon Pattern Data)
year CT-epi
(deg.C)
photons-epi
(mol/kg)
CT-meso
(deg.C)
photons-meso
(mol/kg)
CT-bath
(deg.C)
photons-bath
(mol/kg)
1970 -0.319119 -0.0138434 0.929291 0.0403129 0.521675 0.0226304
1971 -0.14027 -0.00608493 0.955025 0.0414292 0.385543 0.0167249
1972 0.0439672 0.00190731 1.04669 0.0454058 0.502614 0.0218035
1973 -0.0468685 -0.00203317 1.18121 0.0512412 0.650908 0.0282366
1974 -0.0247621 -0.00107419 1.15143 0.0499493 0.65376 0.0283602
1975 0.29194 0.0126644 1.08623 0.0471208 0.495215 0.0214825
1976 -0.155394 -0.00674104 1.01136 0.0438728 0.716331 0.0310746
1977 -0.190929 -0.00828256 0.827497 0.035897 0.429654 0.0186385
1978 -0.316383 -0.0137248 0.879296 0.038144 0.611903 0.0265445
1979 -0.0993832 -0.00431127 0.531673 0.0230641 0.159479 0.00691823
1980 0.136875 0.00593765 0.866777 0.037601 0.589317 0.0255647
1981 0.708836 0.0307495 0.984121 0.0426914 0.53697 0.0232939
1982 0.0250237 0.00108553 0.86963 0.0377248 0.680714 0.0295295
1983 -0.303002 -0.0131443 0.732609 0.0317807 0.42049 0.018241
1984 -0.290215 -0.0125896 0.594551 0.0257918 0.446399 0.0193649
1985 -0.124651 -0.00540741 0.759427 0.0329441 0.305037 0.0132326
1986 -0.51482 -0.022333 0.909067 0.0394355 0.650718 0.0282283
1987 -0.00959874 -0.000416396 0.904362 0.0392314 0.278954 0.0121011
1988 -0.059643 -0.00258733 0.906209 0.0393116 0.303799 0.0131789
1989 -0.453709 -0.019682 0.664909 0.0288439 0.407242 0.0176662
1990 0.225326 0.00977469 0.877907 0.0380838 0.543895 0.0235943
1991 -0.534762 -0.0231981 0.755575 0.032777 0.128646 0.0055807
1992 -0.285562 -0.0123877 1.0243 0.0444342 0.466271 0.0202269
1993 -0.203479 -0.00882696 0.921763 0.0399863 0.279651 0.0121313
1994 -0.666533 -0.0289144 0.829262 0.0359736 0.447205 0.0193999
1995 -0.287767 -0.0124834 0.702632 0.0304803 0.451554 0.0195885
1996 -0.415037 -0.0180044 0.535037 0.02321 0.356081 0.0154469
1997 -0.586546 -0.0254445 0.00721207 0.000312861 -0.203013 -0.00880677
1998 -0.100064 -0.00434081 0.846345 0.0367146 0.570608 0.0247531
1999 -0.205796 -0.00892748 0.869306 0.0377107 0.552353 0.0239612
2000 -0.856688 -0.0371633 0.385243 0.0167119 0.361946 0.0157013
2001 -0.578547 -0.0250975 0.769449 0.0333789 0.364991 0.0158334
2002 -0.233926 -0.0101477 0.79358 0.0344257 0.305139 0.013237
2003 -0.149909 -0.00650307 0.989158 0.0429099 0.412175 0.0178803
2004 -0.159998 -0.00694074 0.989386 0.0429198 0.452181 0.0196157
2005 0.219974 0.00954251 1.36916 0.0593944 0.719178 0.0311981
2006 0.208405 0.00904065 1.47956 0.0641835 0.904651 0.039244
2007 -0.525545 -0.0227983 0.916968 0.0397783 0.716009 0.0310606
2008 -0.509772 -0.022114 0.893293 0.0387513 0.565202 0.0245186
2009 -0.455263 -0.0197494 1.01494 0.0440285 0.840136 0.0364453
2010 -0.355971 -0.0154421 1.02338 0.0443943 0.729001 0.0316242
2011 -0.451178 -0.0195722 1.0544 0.04574 0.543183 0.0235634
2012 -0.10056 -0.0043623 1.17864 0.0511297 0.835612 0.036249
2013 -0.346694 -0.0150397 1.13566 0.049265 0.828124 0.0359242
2014 -0.627741 -0.0272316 0.900494 0.0390637 0.683862 0.0296661
2015 -0.209628 -0.00909371 1.24617 0.054059 0.836961 0.0363075
2016 0.0144119 0.000625192 1.38179 0.0599425 0.83871 0.0363835
2017 -0.120333 -0.00522006 1.23581 0.0536095 0.679697 0.0294854
2018 -0.581878 -0.025242 0.867467 0.0376309 0.779477 0.0338139
2019 -0.283796 -0.0123111 1.20581 0.0523082 0.51286 0.022248


Sector A: Indian Ocean (CT/Photon Pattern Data)
year CT-epi
(deg.C)
photons-epi
(mol/kg)
CT-meso
(deg.C)
photons-meso
(mol/kg)
CT-bath
(deg.C)
photons-bath
(mol/kg)
1970 -1.01069 -0.043844 0.514896 0.0223363 0.114915 0.00498502
1971 -0.559017 -0.0242503 0.996503 0.0432285 0.171872 0.00745585
1972 0.127457 0.00552909 1.18767 0.0515215 0.630462 0.0273496
1973 -0.810611 -0.0351645 0.837071 0.0363123 0.353021 0.0153142
1974 -0.402646 -0.0174669 0.8281 0.0359232 0.128643 0.00558058
1975 0.00616964 0.00026764 1.25645 0.0545052 0.416123 0.0180515
1976 -0.286433 -0.0124255 1.04441 0.0453068 0.204206 0.0088585
1977 0.524104 0.0227358 1.2545 0.0544205 0.221057 0.00958949
1978 0.0249556 0.00108258 0.984211 0.0426953 0.184364 0.00799775
1979 -0.493929 -0.0214268 0.73701 0.0319717 0.203492 0.00882752
1980 -0.820353 -0.0355871 0.547166 0.0237362 0.60387 0.026196
1981 -0.256948 -0.0111465 0.724917 0.0314471 0.298597 0.0129532
1982 -0.377549 -0.0163782 0.807196 0.0350163 0.199993 0.00867574
1983 -0.356161 -0.0154504 0.853457 0.0370232 0.224513 0.00973944
1984 -0.516857 -0.0224214 0.811269 0.035193 0.261122 0.0113275
1985 -0.568661 -0.0246686 0.650338 0.0282118 0.202482 0.00878369
1986 -0.642093 -0.0278542 1.06787 0.0463243 0.245428 0.0106467
1987 -0.369669 -0.0160363 0.911029 0.0395207 0.180055 0.00781082
1988 0.164873 0.00715221 1.21593 0.0527474 0.327847 0.0142221
1989 -1.57048 -0.0681278 -0.292482 -0.0126879 -0.0165471 -0.000717818
1990 0.22169 0.00961697 1.16487 0.0505324 0.477797 0.0207269
1991 -0.345451 -0.0149857 0.593572 0.0257493 0.194136 0.00842167
1992 -0.160981 -0.00698338 0.777519 0.0337289 0.183232 0.00794867
1993 -0.509102 -0.0220849 0.815758 0.0353878 0.151165 0.00655759
1994 0.151466 0.00657062 1.35024 0.0585736 0.301942 0.0130983
1995 0.167174 0.00725206 1.3649 0.0592096 0.312079 0.013538
1996 -0.361928 -0.0157005 1.13868 0.049396 0.232933 0.0101047
1997 -1.37607 -0.0596944 -1.09947 -0.0476953 -0.840926 -0.0364796
1998 0.269066 0.0116721 1.45544 0.0631375 0.654538 0.028394
1999 0.304202 0.0131964 1.39122 0.0603513 0.516475 0.0224048
2000 -0.527434 -0.0228802 1.31314 0.0569642 0.538493 0.02336
2001 -0.606635 -0.026316 0.570616 0.0247535 0.509234 0.0220907
2002 -0.414902 -0.0179986 0.273035 0.0118443 0.0718798 0.00311816
2003 -0.0435026 -0.00188715 0.962449 0.0417513 0.188428 0.00817407
2004 -0.216371 -0.00938624 0.942397 0.0408814 0.326266 0.0141535
2005 -0.123877 -0.00537383 1.01495 0.0440285 0.358623 0.0155571
2006 -0.538545 -0.0233622 0.706728 0.030658 0.170577 0.00739967
2007 -0.549405 -0.0238333 0.899983 0.0390415 0.341296 0.0148055
2008 -1.01464 -0.0440154 0.366728 0.0159088 0.242649 0.0105262
2009 -0.477441 -0.0207115 1.08575 0.0471003 0.658267 0.0285558
2010 -1.04151 -0.0451808 0.424584 0.0184186 0.174701 0.00757859
2011 -0.781976 -0.0339223 0.621837 0.0269755 0.356255 0.0154544
2012 -0.851014 -0.0369172 0.616922 0.0267622 0.439779 0.0190777
2013 -0.221796 -0.00962158 0.983468 0.0426631 0.252153 0.0109385
2014 -0.924674 -0.0401126 0.551916 0.0239423 0.269026 0.0116704
2015 -0.6949 -0.0301449 0.795901 0.0345264 0.352848 0.0153066
2016 -0.478973 -0.0207779 0.800641 0.034732 0.285737 0.0123953
2017 -0.494771 -0.0214633 0.905809 0.0392942 0.349859 0.015177
2018 -0.903118 -0.0391774 0.64221 0.0278592 0.514694 0.0223276
2019 -0.191187 -0.00829375 0.938109 0.0406954 0.261385 0.0113389


Sector B: Western Pacific Ocean (CT/Photon Pattern Data)
year CT-epi
(deg.C)
photons-epi
(mol/kg)
CT-meso
(deg.C)
photons-meso
(mol/kg)
CT-bath
(deg.C)
photons-bath
(mol/kg)
1970 -0.32517 -0.014106 0.891168 0.0386591 0.255786 0.0110961
1971 -0.396319 -0.0171924 0.984832 0.0427222 0.186409 0.00808646
1972 -0.293631 -0.0127378 0.816482 0.0354192 0.169619 0.0073581
1973 0.273683 0.0118725 1.05438 0.0457393 0.236892 0.0102764
1974 -0.0143178 -0.000621111 1.21125 0.0525444 0.386704 0.0167753
1976 0.746958 0.0324032 1.4599 0.063331 1.04839 0.0454796
1977 -0.403323 -0.0174963 0.932426 0.0404488 0.700204 0.030375
1978 -0.514534 -0.0223206 0.445858 0.0193414 -0.0310236 -0.00134581
1979 -0.0239675 -0.00103972 0.779745 0.0338255 -0.00942475 -0.000408848
1980 -0.0540854 -0.00234624 0.736803 0.0319627 0.291692 0.0126537
1981 0.460873 0.0199928 1.06522 0.0462093 0.49283 0.0213791
1982 -0.00628791 -0.000272771 1.35273 0.0586818 0.897915 0.0389517
1983 -0.110559 -0.00479606 1.0751 0.046638 0.365063 0.0158365
1984 0.287805 0.012485 1.20598 0.0523157 0.579839 0.0251535
1985 -0.406933 -0.0176529 0.674644 0.0292662 0.24898 0.0108008
1986 0.10554 0.00457837 1.041 0.0451587 1.17966 0.0511741
1987 -0.249379 -0.0108181 0.668089 0.0289819 0.0713905 0.00309694
1988 -0.0817185 -0.00354497 0.830296 0.0360184 0.251745 0.0109207
1989 -0.830036 -0.0360072 0.409662 0.0177712 0.339332 0.0147203
1990 1.22117 0.0529747 1.65204 0.0716661 0.574658 0.0249288
1991 0.157979 0.00685319 1.25618 0.0544936 0.387437 0.0168071
1992 0.339659 0.0147345 1.01323 0.0439543 0.493998 0.0214297
1993 0.562925 0.0244198 1.21625 0.0527614 0.399727 0.0173402
1994 -0.0926535 -0.00401933 1.09984 0.0477113 0.348926 0.0151365
1995 -0.352695 -0.0153 1.06974 0.0464055 0.304687 0.0132174
1996 -0.339062 -0.0147086 0.855777 0.0371238 0.178439 0.00774072
1997 0.148498 0.00644186 -0.135491 -0.00587764 -0.479613 -0.0208057
1998 0.886212 0.0384441 1.29995 0.0563919 0.617656 0.0267941
1999 0.795013 0.0344878 1.39391 0.0604683 0.888649 0.0385498
2000 -1.24559 -0.0540342 -0.580707 -0.0251912 -0.218975 -0.00949918
2001 0.134949 0.0058541 1.02384 0.0444145 0.293002 0.0127105
2002 0.355896 0.0154388 1.28486 0.0557374 0.446871 0.0193854
2003 -0.118184 -0.00512686 1.04601 0.0453761 0.280746 0.0121788
2004 -0.476004 -0.0206491 0.683204 0.0296375 0.363053 0.0157493
2005 -0.35435 -0.0153718 1.07623 0.0466871 0.532456 0.0230981
2006 0.25195 0.0109296 1.52747 0.0662621 0.636333 0.0276043
2007 -0.255638 -0.0110896 0.993474 0.0430971 0.594861 0.0258052
2008 -0.304381 -0.0132041 0.825033 0.0357901 0.337512 0.0146414
2009 -0.540581 -0.0234505 0.944208 0.0409599 0.800959 0.0347458
2010 -0.127735 -0.00554117 1.14422 0.0496366 0.79539 0.0345042
2011 -0.196618 -0.00852932 1.15422 0.0500704 0.600369 0.0260441
2012 -0.175472 -0.007612 1.197 0.051926 0.447278 0.019403
2013 -0.351203 -0.0152353 1.09074 0.0473167 0.567641 0.0246244
2014 -0.689894 -0.0299278 0.979642 0.0424971 0.645305 0.0279935
2015 -0.425189 -0.0184448 1.02207 0.0443378 0.790037 0.034272
2016 0.107142 0.00464785 1.45819 0.0632566 0.814626 0.0353387
2017 -0.119107 -0.00516688 1.23499 0.053574 0.657848 0.0285376
2018 -0.577033 -0.0250318 1.01772 0.0441491 0.541155 0.0234754
2019 0.15427 0.00669225 1.19811 0.0519743 0.405176 0.0175766


Sector D: Amundsen Sea (CT/Photon Pattern Data)
year CT-epi
(deg.C)
photons-epi
(mol/kg)
CT-meso
(deg.C)
photons-meso
(mol/kg)
CT-bath
(deg.C)
photons-bath
(mol/kg)
1970 0.929508 0.0403223 2.04191 0.0885787 1.32269 0.0573786
1972 1.0547 0.0457531 1.93548 0.0839616 1.36821 0.0593531
1973 0.496613 0.0215432 1.78086 0.077254 1.52709 0.0662454
1974 0.221841 0.0096235 1.84928 0.0802222 1.61026 0.0698534
1976 -0.780726 -0.0338681 1.7807 0.0772471 1.58447 0.0687347
1978 -0.468109 -0.0203067 1.83554 0.079626 1.58273 0.0686591
1981 3.12974 0.135769 2.10823 0.0914557 0.0686591
1982 1.4018 0.0608104 1.97381 0.0856242 1.49614 0.0649028
1983 0.0336644 0.00146037 1.79722 0.0779639 1.19966 0.0520414
1984 0.427593 0.0185491 2.11271 0.0916497 1.24175 0.0538674
1985 1.7248 0.0748221 2.04819 0.0888511 0.0538674
1986 -0.314607 -0.0136477 1.67582 0.0726976 0.734107 0.0318457
1987 1.28947 0.0559373 1.82755 0.0792797 0.992392 0.0430502
1988 -0.354108 -0.0153613 1.65284 0.0717004 0.0430502
1989 0.469275 0.0203573 1.72353 0.0747671 0.805682 0.0349507
1992 0.306695 0.0133045 1.83614 0.079652 0.9633 0.0417882
1994 -0.642545 -0.0278737 1.26678 0.0549531 0.74814 0.0324545
1995 1.09673 0.0475763 2.14993 0.0932643 1.19717 0.0519334
2000 -1.63816 -0.0710639 -0.00846524 -0.000367224 0.641113 0.0278116
2005 1.5944 0.0691657 2.19247 0.09511 1.5172 0.0658163
2006 0.914563 0.039674 2.45211 0.106373 1.81591 0.0787747
2007 -0.439001 -0.0190439 1.28443 0.055719 1.00056 0.0434045
2008 -0.213292 -0.00925266 1.55602 0.0675004 1.04432 0.045303
2009 -0.312422 -0.0135529 1.46197 0.0634205 1.03935 0.0450873
2010 0.0973719 0.00422401 1.71037 0.0741962 1.31215 0.0569214
2011 -0.205254 -0.00890397 1.783 0.0773468 0.935667 0.0405895
2012 0.562157 0.0243865 1.85181 0.0803318 1.37546 0.0596676
2013 0.0702488 0.00304741 1.64664 0.0714317 1.30928 0.0567967
2014 -0.573905 -0.0248961 1.28325 0.0556676 1.1617 0.0503946
2015 0.893714 0.0387695 2.13125 0.0924542 1.64247 0.0712509
2016 0.956901 0.0415106 1.712 0.0742668 1.67175 0.072521
2017 0.497837 0.0215963 1.85561 0.0804966 0.999535 0.0433601
2018 -0.176346 -0.00764991 1.27294 0.0552204 1.37717 0.059742
2019 -0.421784 -0.0182971 1.64833 0.0715047 0.933209 0.0404828


Sector E: Bellingshausen Sea (CT/Photon Pattern Data)
year CT-epi
(deg.C)
photons-epi
(mol/kg)
CT-meso
(deg.C)
photons-meso
(mol/kg)
CT-bath
(deg.C)
photons-bath
(mol/kg)
1970 -0.247139 -0.0107209 1.50311 0.0652054 0.808479 0.035072
1971 1.49909 0.0650308 1.88557 0.0817964 1.12942 0.0489945
1972 0.353202 0.015322 0.875021 0.0379586 0.0489945
1973 0.445823 0.0193399 1.86999 0.0811207 1.27186 0.0551735
1974 0.453475 0.0196718 1.81938 0.0789251 1.13883 0.0494029
1975 1.03371 0.0448424 1.65764 0.0719088 0.808146 0.0350576
1976 0.632891 0.0274549 1.89806 0.0823382 1.21298 0.0526193
1977 -0.424944 -0.0184342 1.3739 0.0596 0.930031 0.0403449
1978 -0.234578 -0.0101761 1.53769 0.0667054 1.37744 0.0597537
1979 0.702023 0.0304539 1.67186 0.0725255 0.865777 0.0375576
1980 1.60948 0.0698198 1.99275 0.086446 1.20027 0.0520679
1981 1.76683 0.0766454 1.41218 0.0612606 1.23612 0.0536234
1982 0.50025 0.021701 1.22457 0.0531222 1.04846 0.0454826
1983 -0.0586868 -0.00254585 0.540254 0.0234364 -0.0674292 -0.00292509
1984 -0.529241 -0.0229586 0.0665957 0.00288894 -0.00292509
1985 0.435007 0.0188707 1.3433 0.0582727 0.841292 0.0364954
1986 -0.682782 -0.0296192 0.591668 0.0256667 1.24106 0.0538374
1987 0.62619 0.0271643 0.997132 0.0432558 0.0538374
1988 1.15033 0.0499017 0.617529 0.0267885 0.0538374
1989 0.912214 0.0395721 1.28973 0.0559487 0.950252 0.0412221
1990 0.560963 0.0243347 1.47225 0.0638665 1.01035 0.043829
1991 -0.6147 -0.0266658 1.27335 0.0552384 0.043829
1992 -0.581465 -0.0252241 1.60623 0.0696784 0.898579 0.0389806
1993 0.258368 0.0112081 1.41687 0.0614641 0.834026 0.0361802
1994 -1.15507 -0.0501074 0.910584 0.0395013 0.784399 0.0340274
1995 -0.176286 -0.00764731 0.524875 0.0227692 0.939011 0.0407345
1996 0.164348 0.00712944 0.193355 0.00838779 0.725564 0.0314751
1997 -0.0647682 -0.00280966 0.724627 0.0314345 0.0314751
1998 -0.240334 -0.0104257 0.977133 0.0423883 1.05489 0.0457616
1999 -0.451409 -0.0195822 0.347745 0.0150852 0.921932 0.0399936
2000 0.24577 0.0106615 1.4465 0.0627493 0.742665 0.032217
2001 -0.974211 -0.0422615 1.18307 0.0513219 0.789928 0.0342672
2002 -0.610173 -0.0264695 0.896934 0.0389092 0.666872 0.0289291
2003 0.243032 0.0105428 1.60128 0.0694637 0.76637 0.0332453
2004 0.211149 0.00915969 1.49081 0.0646718 0.744558 0.0322991
2005 0.341106 0.0147973 1.83633 0.0796604 1.14276 0.0495733
2006 1.34115 0.0581793 2.14862 0.0932075 1.15874 0.0502666
2007 -0.210841 -0.00914635 1.54604 0.0670676 0.991423 0.0430082
2008 -0.394525 -0.0171146 1.29185 0.0560407 0.870983 0.0377834
2009 -0.456828 -0.0198173 1.2648 0.0548674 0.861182 0.0373583
2010 0.108498 0.00470667 1.4386 0.0624067 0.928194 0.0402653
2011 0.194752 0.00844838 1.75834 0.0762773 0.881226 0.0382278
2012 1.05007 0.0455522 2.15097 0.0933094 1.92863 0.0836646
2013 -0.344103 -0.0149272 1.62586 0.0705302 1.8491 0.0802144
2014 -0.236545 -0.0102614 1.59448 0.0691689 1.28948 0.0559379
2015 0.115143 0.00499494 1.7742 0.0769652 1.34936 0.0585357
2016 0.566414 0.0245712 2.80237 0.121568 1.34559 0.058372
2017 0.573302 0.02487 1.91741 0.0831776 1.17052 0.0507773
2018 -0.378758 -0.0164306 0.944379 0.0409674 1.16601 0.0505818
2019 -0.0668257 -0.00289891 1.83796 0.0797313 0.94152 0.0408434


Sector F: Weddell Sea (CT/Photon Pattern Data)
year CT-epi
(deg.C)
photons-epi
(mol/kg)
CT-meso
(deg.C)
photons-meso
(mol/kg)
CT-bath
(deg.C)
photons-bath
(mol/kg)
1970 -0.986345 -0.0427879 -0.17452 -0.00757071 0.0865905 0.00375632
1971 -0.75857 -0.0329069 0.243713 0.0105723 0.163462 0.00709102
1972 -0.527976 -0.0229037 0.480867 0.0208601 -0.0408156 -0.00177059
1973 -0.983166 -0.04265 0.000943351 4.09228e-05 -0.157687 -0.00684052
1974 -0.323043 -0.0140137 0.307795 0.0133522 -0.0274483 -0.00119071
1975 -0.0929304 -0.00403134 0.316756 0.0137409 -0.118421 -0.00513712
1976 -0.163726 -0.00710247 0.0394175 0.00170994 -0.287725 -0.0124816
1977 -0.154974 -0.0067228 0.106787 0.00463246 -0.164645 -0.00714233
1978 -0.456114 -0.0197863 0.290289 0.0125928 -0.163812 -0.0071062
1979 -0.502457 -0.0217967 -0.749347 -0.0325068 -1.50772 -0.0654053
1980 0.201189 0.00872761 0.341905 0.0148319 0.0528228 0.00229147
1981 -0.550273 -0.023871 0.134002 0.00581302 -0.220751 -0.00957623
1982 -0.603581 -0.0261835 0.0748286 0.00324608 -0.265852 -0.0115327
1983 -1.12647 -0.0488663 -0.279775 -0.0121367 -0.172449 -0.00748088
1984 -0.479489 -0.0208003 0.00780357 0.00033852 -0.107922 -0.00468167
1985 -0.974882 -0.0422906 -0.334169 -0.0144963 -0.21025 -0.00912071
1986 -1.2873 -0.0558432 -0.0565657 -0.00245383 -0.064142 -0.00278249
1987 -0.707648 -0.0306979 0.20376 0.00883917 -0.237374 -0.0102973
1988 -0.507429 -0.0220124 0.489139 0.021219 0.214638 0.00931104
1989 -1.16937 -0.0507274 -0.0232841 -0.00101007 -0.185078 -0.00802872
1990 -0.93072 -0.0403748 0.174923 0.0075882 -0.251223 -0.0108981
1991 -1.33688 -0.0579941 -0.100812 -0.00437323 -0.195635 -0.00848668
1992 -1.21888 -0.0528751 0.161642 0.00701207 -0.106175 -0.0046059
1993 -1.12611 -0.0488508 0.238172 0.010332 -0.266315 -0.0115528
1994 -1.03033 -0.044696 0.149176 0.00647131 -0.0248951 -0.00107996
1995 -1.0973 -0.047601 -0.248579 -0.0107834 -0.109216 -0.00473782
1996 -0.996871 -0.0432445 0.28095 0.0121877 -0.188508 -0.00817752
1997 -1.12344 -0.0487353 0.150471 0.00652745 -0.27778 -0.0120502
1998 -0.92659 -0.0401957 0.311579 0.0135164 -0.228555 -0.00991479
1999 -0.945192 -0.0410026 -0.0671482 -0.0029129 -0.117643 -0.00510336
2000 -0.743059 -0.0322341 0.226069 0.00980691 -0.221887 -0.00962551
2001 -0.868291 -0.0376666 0.300266 0.0130256 -0.132197 -0.00573476
2002 -0.266523 -0.0115618 0.719494 0.0312118 0.0349338 0.00151544
2003 -0.520551 -0.0225816 0.424167 0.0184004 0.0328187 0.00142368
2004 -0.0253571 -0.0011 0.662934 0.0287582 0.259426 0.0112539
2005 -0.804611 -0.0349042 0.384713 0.0166889 -0.0896822 -0.00389043
2006 -0.819579 -0.0355535 0.423156 0.0183566 0.276009 0.0119733
2007 -1.18634 -0.0514638 0.193315 0.00838603 0.361749 0.0156928
2008 -1.11073 -0.0481838 0.169865 0.00736878 -0.0246605 -0.00106978
2009 -1.06547 -0.0462202 0.128645 0.00558067 -0.0194367 -0.00084317
2010 -0.784951 -0.0340513 0.39156 0.016986 -0.037827 -0.00164094
2011 -1.05186 -0.0456301 0.108261 0.0046964 -0.0152361 -0.000660944
2012 -0.882126 -0.0382668 0.441397 0.0191479 0.0626903 0.00271952
2013 -0.748343 -0.0324633 0.399034 0.0173102 -0.130584 -0.00566477
2014 -1.01208 -0.0439044 0.171787 0.00745214 0.00532523 0.00023101
2015 -0.71864 -0.0311748 0.406231 0.0176224 -0.0440923 -0.00191274
2016 -0.70246 -0.0304729 0.370776 0.0160843 0.0178506 0.000774364
2017 -0.731293 -0.0317237 0.396821 0.0172142 0.0871275 0.00377961
2018 -1.06698 -0.0462859 0.168725 0.00731932 0.169719 0.00736246
2019 -0.479562 -0.0208035 0.530146 0.0229978 0.0315929 0.00137051

Appendix B (graphs)

This is an appendix to: Quantum Oceanography - 3


Fig. 1 Antarctica Sectors A-F and WOD zones

Fig. 2 Antarctica Sectors A-F


Sunday, April 5, 2020

The World According To Measurements - 26

The Blank Forest
I. Is This Ours?

Which "our" is it?

Rising Tides, Troubled Waters: The Future of Our Ocean

The ocean is growing like an onion, and some of the "science" is unionized onionized.

The outer skin is growing over the wounds of civilization like a fog over the marsh, and the origin of the new skin is more unknown to "our" science than the "skin" of Mars or the Moon (The World According To Measurements - 24, Hold On To Something Alright).

I use the word "fog" because the fear-based denial enveloping the minds of many of us covers up the origin of the new outer layers of sea level change emerging one after the other.

The new source of the onion layers is Antarctica, a place that doesn't seem to be wanted, and doesn't seem to be "ours."

II. Make The Data Ours

The number one cause of the spread of global warming induced climate change denial is propaganda created and promoted by the fossil fuel industry's funding of various institutions in both hidden and in open for all to see ways (EOS, AGU).

They promote fossil fuel use (The Harm Oil-Qaeda Has Done).

On their blogs they resist warnings about Humble Oil-Qaeda.

In fact, today and a few days ago the following comments of mine (made on one of their blogs) were deleted:
"The important fact finding mission, where the researchers drilled down to the grounding line, was classic. The new reality they discovered, confirming previous hypotheses (the "warmer" water is deep) is fundamental now. Using the TEOS-10 (teos-10.org) tools suggested that this was the case. But more than that, it suggests that this is the case all around the coast of Antarctica where there are grounding lines (The Ghost Plumes - 12)"
...
"Eos could help by not censoring comments. The Ghost Plumes - 12"
(From Disqus recordings of Dredd Blog comments). Meanwhile they promote fossil fuel usage (Where and How Can We Find New Sources of Oil and Gas?, Largest Ever U.S. Shale Oil Deposit Identified in Texas).

Their membership is not allowed to vote on this issue, causing some to drop their lifetime membership (see comments here, the discussion here, and the discussion here).

So, encourage your institutions of all kinds to stop it because it skews the research and does damage to what is "ours."

III. The Honest Data

Regular readers know that here on Dredd Blog the facts rule the day, not Oil-Qaeda propaganda.

So, true to fashion readers will be given data analysis free of charge, data which comes from the World Ocean Database (WOD).

It is then deciphered and converted into an SQL-server database (WOD Update).

The graphs made for today's post are supported with HTML tables containing the details in the database.

The relevant information is provided in the appendices to today's post, which features the Antarctica Ice Sheet's interaction with the ocean all along the grounding line of Antarctica's Tidewater Glaciers.

IV. General Details About The Data In The Appendices

The appendices are organized according to the melting process at the grounding lines: first comes melt conditions (ambient water containing a sufficient number of infrared photons), then comes ice melting into seawater, and finally plumes are caused by the differences in the density of the glacial melt water compared to the denser ambient seawater.

So, Appendix A&B feature data concerning melt conditions, presented in HTML tables (Appendix A) and graphs based on that HTML data (Appendix B).

The top lines show the temperatures of the seawater, while the lower lines show the temperature at which ice will melt there in those conditions.

As long as the seawater temperature is above the temperature at which the Tidewater Glacier's ice will melt, there will be plumes.

The graph lines are color coded as to depth and temperature (a legend on each graph explains that).

The glacial ice melt dynamics concept is likewise presented in two appendices (C&D).

One is in the format of HTML tables (Appendix C), and the other is in the format of graphs (Appendix D).

Finally, the plume flow dynamics concept is presented in the same two formats, HTML (Appendix E) and graphs (Appendix F).

NOTE: the glacial ice and plume flow quantities are estimates.

Currently the distribution between above sea level basal melt (on land) and calving, compared to below sea level (under water along and above the grounding line) is 32% (above) / 68% (below).

This ratio is only an estimate because we do not know exactly, but it is being made more accurate as time goes on (the total ice mass loss for Antarctica, i.e. both above and below sea level, is detailed here).

The temperatures in the sea water data presentations are made from actual in situ measurements downloaded from the WOD database, then averaged.

The temperatures at which ice will melt are calculated with the TEOS-10 toolbox, using the actual in situ measurements just mentioned.

V. Closing Comments

When added up the subtotals don't always match the totals for some areas because the graphing software requires some "smoothing."

That is, there are gaps in the in situ measurement record, so when data gaps take place, and when possible, the gaps are filled in by the software (by averaging the closest numbers to the gaps).

The bottom line is that the trend of the disintegration of the Antarctic Ice Sheet is not an estimate, but how fast the degeneration will accelerate is an estimate.

The trend is crystal clear.

The ice sheet disintegration into seawater has increased about six-fold over the time span shown in the appendices (detailed by glaciologists here).

The next post in this series is here, the previous post in this series is here.


Appendix A (melt conditions)

This is an Appendix to: The World According To Measurements - 26

Fig. 1 Antarctica Sectors A-F and WOD zones

Fig. 2 Antarctica Sectors A-F

Ice Melt Conditions In All Sectors


Legend:

"ct" = Conservative Temperature (deg. Celsius)
"ctf" = ice melt temperature (deg. Celsius)

"epi" = epipelagic depth (0-200 m)
"meso" = mesopelagic depth (201-1000 m)
"bath" = bathypelagic depth (1001-4000 m)


All Antarctica Averages (ICE MELT FACTORS)
year ct_epi ctf_epi ct_meso ctf_meso ct_bath ctf_bath
1970 -0.52242 -1.81913 0.152999 -2.09385 0.469383 -3.03519
1971 -0.156702 -1.76436 0.910279 -2.08805 0.395028 -3.02276
1972 -0.195334 -1.8728 0.716951 -2.198 0.265218 -3.0522
1973 -0.484318 -1.89139 1.05479 -2.23775 0.507626 -2.91843
1974 -0.212756 -1.33792 0.563122 -1.55987 0.563568 -3.02131
1975 0.022218 -1.8774 0.632436 -2.192 0.534705 -2.98443
1976 -0.227495 -1.51007 0.305474 -1.78687 0.434731 -2.94662
1977 -0.134613 -1.75644 0.389147 -2.13629 0.660908 -2.95336
1978 -0.283912 -1.76311 0.385495 -2.09688 0.211638 -2.95661
1979 -0.225591 -1.88957 0.330748 -2.21084 0.155086 -2.87891
1980 -0.585031 -1.52218 0.0859101 -1.82163 0.529016 -2.87861
1981 -0.211038 -1.87025 0.337678 -2.21704 0.720278 -2.91473
1982 -0.124729 -1.89058 0.406578 -2.28691 0.448787 -2.85497
1983 -0.578585 -1.83515 0.0569305 -2.15639 0.00877255 -2.8642
1984 -0.548446 -1.77767 -0.202192 -2.09116 0.230622 -2.97833
1985 -0.425197 -1.89417 0.411393 -2.26828 0.298341 -3.03361
1986 -0.574106 -1.77793 0.456307 -2.01545 0.643166 -2.88382
1987 -0.662679 -1.79109 0.292313 -2.06717 0.0760252 -2.91967
1988 -0.197478 -1.87659 0.446717 -2.23435 0.380714 -2.91862
1989 -0.798061 -1.90814 0.216184 -2.25916 0.287185 -2.88621
1990 0.0157988 -1.88139 0.548796 -2.26366 0.411361 -3.00201
1991 -0.573757 -1.88725 0.650148 -2.22102 0.127916 -3.07292
1992 -0.473316 -1.55506 0.362449 -1.82248 0.305979 -2.99321
1993 -0.428766 -1.81037 0.603987 -2.13707 0.226722 -3.0261
1994 -0.875718 -1.84142 0.389215 -2.17757 0.498753 -2.99275
1995 -0.707819 -1.82665 0.0647771 -2.16851 0.246689 -3.07396
1996 -0.639313 -1.71248 -0.128175 -2.02187 -0.178094 -3.0651
1997 -0.74681 -1.8996 -0.433127 -2.25276 -0.602637 -2.91475
1998 -0.260014 -1.90362 0.184533 -2.26156 0.510561 -3.0171
1999 -0.336537 -1.88565 0.317011 -2.24584 0.591186 -2.94058
2000 -0.867822 -1.90326 0.0984308 -2.26038 0.350223 -2.96933
2001 -0.388514 -1.88971 0.777477 -2.17314 0.551855 -2.92997
2002 -0.0578255 -1.88664 0.803462 -2.23276 0.546743 -2.90684
2003 -0.245874 -1.88295 0.801554 -2.243 0.368439 -3.03547
2004 -0.182204 -1.88898 0.991107 -2.26052 0.536018 -3.02781
2005 -0.265203 -1.74077 1.03118 -2.08371 0.535447 -3.01034
2006 -0.0322819 -1.51721 1.29064 -1.75925 0.632335 -2.99532
2007 -0.906709 -1.89593 0.5071 -2.23058 0.50551 -2.90162
2008 -0.853041 -1.83404 0.570734 -2.1732 0.526226 -2.92788
2009 -0.722734 -1.89452 0.654987 -2.24411 0.8026 -2.92762
2010 -0.723338 -1.83432 0.819555 -2.1481 0.622238 -2.85542
2011 -0.854324 -1.89767 0.526817 -2.25379 0.537798 -2.93008
2012 -0.851147 -1.90788 0.701737 -2.26961 0.550109 -2.88533
2013 -0.718504 -1.7931 0.809306 -2.10412 0.720293 -2.92415
2014 -1.0241 -1.90564 0.422402 -2.24158 0.311463 -2.85223
2015 -0.523675 -1.89231 0.815324 -2.23892 0.719178 -2.89768
2016 -0.51785 -1.88476 0.648274 -2.21974 0.675214 -2.97751
2017 -0.454795 -1.89392 1.07992 -2.24011 0.691078 -2.91412
2018 -0.932704 -1.86645 0.530191 -2.19752 0.597837 -2.85957
2019 -0.493173 -1.79411 1.05283 -2.15189 0.570945 -2.95934


Sector A: Indian Ocean (ICE MELT FACTORS)
year ct_epi ctf_epi ct_meso ctf_meso ct_bath ctf_bath
1970 -1.17751 -1.89406 -0.367936 -2.14501 0.36492 -2.95879
1971 -0.607513 -1.88526 1.11476 -2.16111 0.242789 -3.06
1972 0.127457 -1.87431 1.21483 -2.25128 0.630462 -2.84606
1973 -0.820877 -1.90757 0.791479 -2.25347 0.364373 -2.95442
1974 -0.412139 -0.941263 0.29496 -1.12987 0.175545 -3.15075
1975 -0.0328626 -1.88355 1.52292 -2.14028 0.662471 -2.92546
1976 -0.129761 -1.87435 0.878016 -2.12439 0.204206 -3.06078
1977 0.284085 -1.24908 0.372777 -1.49848 0.298438 -3.11755
1978 0.390649 -1.87064 1.0137 -2.3391 0.326919 -2.98044
1979 -0.607788 -1.88328 0.410798 -2.21851 0.159059 -3.19063
1980 -0.727686 -1.89953 0.624393 -2.25782 0.696607 -2.75229
1981 -0.302052 -1.89643 0.753719 -2.29052 0.409616 -2.97757
1982 -0.377549 -1.89544 0.834598 -2.26996 0.20893 -3.09419
1983 -0.148546 -1.56503 0.931437 -1.86044 0.309609 -3.01832
1984 -0.413317 -1.26576 0.133101 -1.47765 0.386798 -2.98792
1985 -0.589543 -1.89255 0.621546 -2.2726 0.255719 -2.96592
1986 -0.369456 -1.2521 0.714884 -1.12218 0.282276 -3.0854
1987 -0.558273 -1.35853 0.297326 -1.52439 0.180207 -3.1273
1988 0.397827 -1.84022 1.405 -2.23702 0.558156 -2.98399
1989 -1.57048 -1.9302 -0.316341 -2.30167 -0.0143464 -2.94434
1990 0.22169 -1.87296 1.16369 -2.30159 0.497158 -2.91447
1991 -0.345451 -1.8912 0.626532 -2.22587 0.167833 -2.89289
1992 -0.160981 -1.87664 0.923872 -2.24658 0.192836 -3.00701
1993 -0.433389 -1.56705 0.211135 -1.81503 0.177115 -3.02117
1994 0.371742 -1.55443 1.24081 -1.86003 0.348775 -3.13553
1995 0.167174 -1.86777 1.3649 -2.27939 0.334369 -3.08954
1996 -0.17546 -0.946209 0.664655 -1.11218 0.278069 -3.16079
1997 -1.37607 -1.9099 -1.09947 -2.29465 -0.840926 -2.74249
1998 0.283442 -1.89455 1.45915 -2.27177 0.669939 -2.98962
1999 -0.208234 -1.88061 1.11615 -2.4306 0.566954 -3.04882
2000 -0.527434 -1.88993 1.31314 -2.29499 0.538493 -3.03119
2001 -0.606635 -1.89045 0.570616 -2.25514 0.509234 -2.98074
2002 -0.142478 -1.89195 0.296032 -2.26177 0.372218 -2.82999
2003 0.044179 -1.87209 0.992852 -2.33315 0.264646 -2.9532
2004 -0.216371 -1.87444 0.910481 -2.21049 0.330055 -3.00063
2005 0.0794041 -1.87852 1.07218 -2.25996 0.375223 -2.86521
2006 -0.0746962 -0.942805 0.333754 -1.12361 0.218095 -3.11545
2007 -0.524554 -1.88858 0.934547 -2.28187 0.338349 -2.94875
2008 -0.949268 -1.52019 0.115261 -1.78587 0.407389 -2.89283
2009 -0.439262 -1.89518 1.09558 -2.26621 0.699396 -2.8754
2010 -1.15236 -1.91778 0.308371 -2.24055 0.12345 -2.84815
2011 -0.879607 -1.90337 0.556343 -2.30149 0.361139 -2.85177
2012 -0.88632 -1.89908 0.637057 -2.24683 0.45815 -2.8465
2013 -0.181671 -1.25365 0.510464 -1.54915 0.254962 -3.1882
2014 -0.975915 -1.89972 0.512839 -2.24142 0.272408 -2.85315
2015 -0.706567 -1.89723 0.80623 -2.25474 0.384896 -2.84301
2016 -0.462951 -1.89444 0.818384 -2.2089 0.275726 -2.88385
2017 -0.528544 -1.88897 0.913364 -2.32095 0.374397 -2.87176
2018 -0.779925 -1.912 0.715907 -2.26831 0.522772 -2.84805
2019 -0.154892 -1.56519 0.783442 -1.89175 0.325839 -2.95136


Sector B: Western Pacific Ocean (ICE MELT FACTORS)
year ct_epi ctf_epi ct_meso ctf_meso ct_bath ctf_bath
1970 -0.279189 -1.89879 0.641177 -2.2437 0.216133 -3.07666
1971 -0.396319 -1.89773 0.998482 -2.23609 0.092714 -3.05386
1972 -0.293631 -1.88655 0.190132 -2.21493 0.174683 -3.13818
1973 0.273683 -1.87547 1.25713 -2.17922 0.244928 -2.90867
1974 -0.0143178 -1.8956 1.21117 -2.25116 0.604124 -2.84064
1976 0.746958 -1.88228 1.48911 -2.22939 0.912719 -2.86802
1977 -0.403323 -1.8975 0.768014 -2.24287 0.735447 -2.85202
1978 -0.514534 -1.88823 0.510931 -2.18955 0.438806 -2.92646
1979 -0.0243037 -1.88994 0.855324 -2.21434 0.434154 -2.84956
1980 -0.0540854 -1.8899 0.764161 -2.20156 0.484146 -2.73248
1981 0.460873 -1.88306 1.06522 -2.2389 0.571525 -2.92679
1982 -0.00628791 -1.87781 1.3333 -2.2813 0.897915 -2.67835
1983 -0.110559 -1.89712 1.0751 -2.25854 0.510008 -2.9566
1984 0.287805 -1.87278 1.21592 -2.23741 0.587879 -3.16162
1985 -0.406933 -1.89846 0.664151 -2.22232 0.551278 -2.85465
1986 0.10554 -1.88135 1.09216 -2.20801 1.17966 -2.67217
1987 -0.249379 -1.88806 0.707438 -2.28347 0.324942 -2.74467
1988 -0.0817185 -1.87919 0.846955 -2.27312 0.30206 -2.89741
1989 -0.830036 -1.91421 0.390351 -2.19389 0.289819 -2.84344
1990 1.22117 -1.86085 1.67002 -2.20473 0.619413 -3.0818
1991 0.20504 -1.85698 1.25618 -2.38101 0.387437 -3.29393
1992 0.339659 -1.87456 0.966888 -2.21562 0.469355 -2.87077
1993 0.562925 -1.86944 1.21625 -2.23993 0.376787 -3.03521
1994 -0.0782683 -1.87149 1.09984 -2.28795 0.340101 -3.11294
1995 -0.352695 -1.88676 1.06974 -2.26479 0.271586 -3.13958
1996 -0.339062 -1.89513 0.855777 -2.23015 0.180069 -3.14401
1997 0.148498 -1.87112 -0.135491 -2.27239 -0.471393 -3.12969
1998 0.886212 -1.89606 1.29995 -2.27006 0.603254 -2.88235
1999 0.800434 -1.84504 1.38143 -2.17621 0.888649 -2.8755
2000 -1.24559 -1.92418 -0.580707 -2.29205 -0.218975 -2.97139
2001 0.134949 -1.88948 1.02384 -2.21222 0.333054 -3.08062
2002 0.355896 -1.88141 1.28486 -2.24731 0.454084 -3.07292
2003 -0.118184 -1.88491 1.04601 -2.24644 0.293769 -2.96007
2004 -0.476004 -1.89431 0.683204 -2.23166 0.437385 -3.0083
2005 -0.35435 -1.89576 1.07623 -2.26938 0.559691 -2.97482
2006 0.25195 -1.88453 1.52747 -2.25587 0.743393 -2.94178
2007 -0.255638 -1.8877 0.993474 -2.25624 0.646289 -2.94748
2008 -0.304381 -1.88855 0.825033 -2.2832 0.302434 -2.97037
2009 -0.540581 -1.89633 0.944208 -2.24796 0.800959 -2.82283
2010 -0.127735 -1.88789 1.14422 -2.27096 0.790337 -2.83811
2011 -0.196618 -1.89316 1.15422 -2.26591 0.63887 -2.92181
2012 -0.175472 -1.88494 1.197 -2.25262 0.457396 -3.10921
2013 -0.351203 -1.88904 1.09074 -2.27956 0.589998 -2.93792
2014 -0.689894 -1.89672 0.979642 -2.23617 0.729613 -2.99499
2015 -0.425189 -1.89479 1.02207 -2.28724 0.877119 -2.946
2016 0.107142 -1.87814 1.45819 -2.27287 0.855865 -2.83608
2017 -0.119107 -1.89756 1.23499 -2.24255 0.711407 -2.89666
2018 -0.133166 -1.65091 0.922187 -1.95667 0.580992 -2.97093
2019 0.101975 -1.61197 0.997874 -1.93531 0.409428 -3.05317


Sector C: Ross Sea (ICE MELT FACTORS)
year ct_epi ctf_epi ct_meso ctf_meso ct_bath ctf_bath
1970 -0.584777 -1.90354 -0.692335 -2.15251
1971 -0.618501 -1.27416 0.231319 -1.51382 0.166081 -3.0702
1972 -0.824336 -1.88907 0.635036 -2.2349 -0.163312 -3.0607
1973 -0.574981 -1.89343 1.01926 -2.35072 0.349747 -2.83393
1974 -1.18355 -1.96849 -0.516589 -2.1898 0.968852 -3.13662
1975 -0.267507 -1.88341 0.782168 -2.23202 0.660959 -2.7693
1976 -1.21998 -1.91016 -0.670791 -2.27187 0.514226 -2.75471
1977 -0.244811 -1.87272 -0.534332 -2.36966 0.582171 -2.79163
1978 -0.744712 -1.9271 -0.924874 -2.24046 -0.423796 -2.74305
1979 -0.641993 -1.89528 -0.534894 -2.20936 0.824165 -2.67919
1980 -0.626287 -1.89462 -0.0872996 -2.20504 0.584955 -2.6855
1981 -0.933499 -1.90137 -0.158929 -2.1976 0.663847 -3.00704
1982 -0.616432 -1.9142 -0.229968 -2.23695 0.63037 -2.76956
1983 -0.85084 -1.9037 -0.441271 -2.2018 0.895175 -2.67768
1984 -0.833024 -1.90974 -0.826133 -2.33079 -0.457963 -2.79617
1985 -0.993766 -1.92023 0.0321673 -2.25481 0.392438 -3.05536
1986 -0.35658 -1.9147 0.68655 -2.20422 0.410087 -2.83323
1987 -0.703954 -1.90708 -0.156244 -2.13919 -0.00042503 -2.77247
1988 -0.890519 -1.90001 -0.064913 -2.27074 0.274228 -2.9594
1989 -1.25114 -1.90813 0.00796528 -2.22633 0.315436 -2.82967
1990 -1.05344 -1.94989 -1.20786 -2.2383 0.260633 -2.83656
1992 -0.824516 -1.90544 -0.323371 -2.22191 0.055225 -2.97454
1994 -1.49935 -1.913 -0.446182 -2.217 0.508774 -3.04627
1995 -1.31831 -1.93042 -0.683638 -2.28604 0.0276553 -2.99506
1996 -1.53899 -1.95014 -1.82169 -2.27124 -1.91236 -2.75222
1997 -1.43527 -1.93263 -1.35478 -2.26892 -0.727773 -2.74618
1998 -1.30586 -1.93594 -1.89653 -2.21421 -2.74618
2000 -1.38552 -1.90898 -0.564417 -2.2157 0.690451 -2.96931
2003 -0.758719 -1.91074 0.0137501 -2.26895 0.387669 -2.92597
2004 -0.96586 -1.90718 0.412883 -2.26663 0.156428 -2.93721
2005 0.0778493 -1.86648 1.63462 -2.23987 0.905543 -2.91961
2006 0.19603 -1.87519 1.56374 -2.13929 1.59933 -2.87622
2007 -1.06025 -1.90287 -0.237486 -2.23997 0.215916 -2.79693
2008 -0.659074 -1.90664 0.47118 -2.24848 0.750685 -2.94739
2009 -0.428745 -1.88851 0.27119 -2.23751 1.16072 -2.98758
2010 -0.899849 -1.90318 0.496003 -2.20963 1.03859 -2.78106
2011 -1.20919 -1.90719 0.219438 -2.23253 0.385058 -3.02538
2012 -0.857444 -1.93424 -0.75881 -2.27607 -0.188038 -2.87126
2013 -0.572333 -1.90234 0.369751 -2.25332 1.06837 -2.83416
2014 -1.02312 -1.91503 -0.219885 -2.25754 -0.465585 -2.79478
2015 -0.54506 -1.87489 1.35927 -2.24845 0.765789 -2.83538
2016 -0.646678 -1.879 0.852679 -2.20441 0.826816 -2.81686
2017 -0.846435 -1.89805 0.712679 -2.22429 0.666583 -2.96735
2018 -0.765211 -1.90408 0.6809 -2.22637 0.801825 -2.82798
2019 -1.00336 -1.90448 0.815856 -2.30585 0.442671 -3.04892


Sector D: Amundsen Sea (ICE MELT FACTORS)
year ct_epi ctf_epi ct_meso ctf_meso ct_bath ctf_bath
1973 -1.07063 -1.90736 1.51199 -2.14873 1.11692 -2.67323
1994 -1.37206 -1.89618 0.741293 -2.2633 0.618244 -3.00013
2000 -1.63816 -1.91289 -0.00846524 -2.23592 0.659828 -2.78005
2006 0.482612 -1.74692 2.67455 -1.99443 -2.78005
2007 -1.44846 -1.897 0.637246 -2.22762 0.759123 -2.91447
2008 -1.35684 -1.89559 0.9943 -2.22897 0.783203 -2.84387
2009 -1.09292 -1.88625 0.985064 -2.28011 0.923343 -2.80571
2010 -1.12082 -1.89229 1.28945 -2.2483 0.890849 -2.80297
2011 -1.60428 -1.88277 1.20374 -2.24834 0.907505 -2.82611
2012 -1.73246 -1.90908 0.998618 -2.37655 0.776518 -2.7855
2013 -1.4219 -1.91028 1.11008 -2.18578 0.819915 -2.87916
2014 -1.41632 -1.90642 0.475475 -2.2655 0.608869 -2.84983
2016 -0.839515 -1.91555 -0.435345 -2.14912 -2.84983
2017 -0.306109 -1.90651 1.56254 -2.23064 0.816883 -3.05248
2018 -1.28329 -1.90902 0.509885 -2.24157 0.642059 -2.77527
2019 -0.811333 -1.88751 1.33554 -2.25378 0.974138 -2.81766


Sector E: Bellingshausen Sea (ICE MELT FACTORS)
year ct_epi ctf_epi ct_meso ctf_meso ct_bath ctf_bath
1970 0.806207 -1.86929 1.88609 -2.17239 1.18282 -3.0588
1971 1.49909 -1.85586 1.88557 -2.22498 1.12942 -2.96943
1972 0.353202 -1.83858 0.875021 -2.08134 -2.96943
1973 0.547448 -1.84075 1.9192 -2.17722 1.07924 -3.10621
1974 0.546229 -1.88427 1.82607 -2.22852 0.913242 -2.89235
1975
-1.85205
-2.25501 0.808146 -3.20834
1976


0.896925 -3.15352
1977 0.198082 -1.86818 1.47902 -2.32385 0.966071 -3.2775
1978 -0.0975886 -1.87128 1.31438 -2.23636 0.857655 -2.70213
1979 0.702023 -1.86989 1.67186 -2.20409 0.865777 -2.9517
1980


0.927165 -3.27196
1981 0.162555 -1.8306 0.937916 -2.20807 1.23612 -2.74752
1982 0.310196 -1.86928 0.425847 -2.31569 0.838143 -2.80059
1983 -0.354134 -1.90032 -0.399382 -2.22347 -1.13162 -2.76859
1984 -0.756086 -1.92259 -0.483536 -2.18188 -2.76859
1985 0.757623 -1.83947 1.28058 -2.30288 0.841292 -3.16783
1986 -0.610399 -1.90303 0.397873 -2.2753 1.24106 -2.88373
1987 -0.571274 -1.87533 0.569733 -2.16273 -2.88373
1988 0.254934 -1.86416 -0.330548 -2.09518 -2.88373
1989 0.912214 -1.86462 1.28973 -2.31641 0.950252 -2.76245
1990 0.687849 -1.8155 1.34634 -2.2754 1.01035 -3.13871
1991 -0.6147 -1.89825 1.27335 -2.07409 -3.13871
1992 -0.733667 -0.960267 0.540812 -1.04982 0.87745 -3.07806
1993 -0.42863 -1.88263 0.8468 -2.29746 0.621464 -3.15166
1994 -1.38195 -1.89912 0.268785 -2.21488 0.852887 -2.86591
1995 -1.00174 -1.91249 -0.858698 -2.21987 0.615752 -3.07476
1996 0.164348 -1.85446 0.193355 -2.26116 0.725564 -3.22378
1997 -0.0647682 -1.86327 0.724627 -2.12355 -3.22378
1998 -0.240334 -1.88629 0.977133 -2.28255 1.05489 -3.10203
1999 -0.451409 -1.89573 -0.154931 -2.15779 0.921932 -2.98573
2000 0.425915 -1.88481 1.4124 -2.3396 0.710049 -3.04973
2001 -1.00424 -1.88568 1.04178 -2.06476 1.25112 -2.69769
2002 -0.574294 -1.8787 0.428463 -2.18463 0.83092 -2.70771
2003 0.21743 -1.8582 1.62185 -2.2069 0.770015 -3.20917
2004 0.3759 -1.86459 1.42968 -2.32662 0.734606 -3.34596
2005 -0.38704 -1.15125 1.07325 -1.38511 0.704359 -3.26429
2006 -0.313734 -1.22003 1.27223 -1.33999 0.60896 -3.04353
2007 -0.636877 -1.87574 1.24286 -2.19648 0.79535 -2.92397
2008 -0.520848 -1.87808 1.20906 -2.25038 0.774641 -3.01916
2009 -0.605515 -1.87595 0.732408 -2.19015 0.966472 -3.21407
2010 -0.380374 -1.88031 1.33157 -2.22197 0.760147 -2.94289
2011
-1.86849
-2.18496 0.798518 -3.11175
2012 -0.395342 -1.88836 1.63042 -2.15017 1.65667 -2.89464
2013 -0.830662 -1.89398 1.34141 -2.12226 1.4226 -2.77715
2014 -0.676896 -1.89563 1.18496 -2.21343 0.670585 -2.77236
2015 -0.00799524 -1.89032 1.45118 -2.2149 1.1248 -2.8953
2016 -0.196748 -1.83767 1.67389 -2.23991 1.02172 -2.93093
2017 0.192205 -1.86378 1.85532 -2.14732 1.27541 -2.81608
2018 -1.0962 -1.90064 0.396986 -2.242 0.614829 -2.89696
2019 -0.217106 -1.88387 1.8 -2.25522 1.03399 -2.97615


Sector F: Weddell Sea (ICE MELT FACTORS)
year ct_epi ctf_epi ct_meso ctf_meso ct_bath ctf_bath
1970 -1.37683 -1.52995 -0.702 -1.75566 0.113661 -3.04651
1971 -0.660266 -1.9088 0.321261 -2.30424 0.344136 -2.96032
1972 -0.339363 -1.87551 0.669736 -2.20758 0.419038 -3.16388
1973 -1.26055 -1.92373 -0.170332 -2.31716 -0.109458 -3.03412
1974


0.156078 -3.08617
1975 0.389241 -1.89059 0.224652 -2.14071 0.00724515 -3.03462
1976 -0.534695 -1.88355 -0.168959 -2.30873 -0.35442 -2.89607
1977 -0.507098 -1.89471 -0.139749 -2.24659 0.722413 -2.72811
1978 -0.453375 -1.2583 0.0133403 -1.47892 -0.141394 -3.43097
1979 -0.555896 -1.90943 -0.749347 -2.20793 -1.50772 -2.72349
1980 -1.5171 -1.92685 -0.871704 -2.44373 -0.0477955 -2.95082
1981 -0.443066 -1.83976 -0.909532 -2.15013 -2.95082
1982 0.066428 -1.89615 -0.330884 -2.33068 -0.331425 -2.93218
1983 -1.42885 -1.90959 -0.881229 -2.23768 -0.539308 -2.89978
1984 -1.02761 -1.91749 -1.05031 -2.22805 0.405775 -2.96762
1985 -0.893367 -1.92015 -0.541484 -2.28877 -0.549019 -3.12428
1986 -1.63964 -1.93847 -0.609936 -2.26753 0.102744 -2.94456
1987 -1.23052 -1.92646 0.0433131 -2.22604 -0.200624 -3.03424
1988 -0.667911 -1.89938 0.377091 -2.29569 0.388412 -2.83369
1989 -1.25086 -1.92352 -0.290782 -2.25749 -0.105238 -3.05117
1990 -0.998278 -1.90774 -0.228198 -2.29828 -0.330742 -3.03849
1991 -1.53992 -1.90256 -0.555478 -2.20311 -0.171521 -3.03194
1992 -0.987077 -1.15839 -0.295957 -1.37845 -0.0649692 -3.03569
1993 -1.41597 -1.92236 0.141758 -2.19584 -0.268478 -2.89635
1994 -1.29442 -1.91429 -0.569254 -2.22228 0.323735 -2.79574
1995 -1.03353 -1.5358 -0.568415 -1.79248 -0.0159193 -3.07086
1996 -1.3074 -1.91645 -0.532972 -2.23462 -0.161813 -3.04469
1997 -1.00644 -1.92106 -0.300523 -2.30432 -0.370459 -3.04066
1998 -0.923528 -1.90528 -0.917038 -2.26921 -0.285845 -3.09441
1999 -1.48694 -1.92124 -1.0746 -2.21877 -0.0127898 -2.85227
2000 -0.836137 -1.89879 -0.981363 -2.18401 -0.278511 -3.01428
2001 -0.0781286 -1.89321 0.473665 -2.16043 0.114013 -2.96084
2002 0.129575 -1.89449 1.20449 -2.23733 0.529748 -3.01673
2003 -0.614076 -1.88879 0.333311 -2.15956 0.126097 -3.12893
2004 0.371316 -1.90437 1.51928 -2.26719 1.02162 -2.84693
2005 -0.741879 -1.91183 0.299618 -2.26423 0.132421 -3.02775
2006 -0.735853 -1.43379 0.372074 -1.70229 -0.0081008 -2.99964
2007 -1.51447 -1.9237 -0.528037 -2.1813 0.278031 -2.87814
2008 -1.32783 -1.91522 -0.190429 -2.24226 0.139001 -2.89368
2009 -1.22939 -1.92492 -0.0985338 -2.24271 0.264711 -2.86014
2010 -0.658887 -1.52447 0.34772 -1.69719 0.130052 -2.91932
2011 -1.23625 -1.93103 0.0271522 -2.2895 0.135697 -2.84368
2012 -1.05984 -1.93157 0.50614 -2.3154 0.139957 -2.80487
2013 -0.95326 -1.90933 0.433378 -2.23466 0.165912 -2.92834
2014 -1.36242 -1.92032 -0.398625 -2.23541 0.0528855 -2.84825
2015 -0.933563 -1.90432 -0.56213 -2.18929 0.443283 -2.96873
2016 -1.06835 -1.90374 -0.478152 -2.2432 0.395944 -3.4198
2017 -1.12078 -1.90864 0.200636 -2.27491 0.301787 -2.88036
2018 -1.53843 -1.92202 -0.0447185 -2.25019 0.424547 -2.83824
2019 -0.874324 -1.91161 0.584287 -2.26939 0.239608 -2.90877