Friday, September 14, 2018

Mysterious Zones of The Arctic - 3

Fig. 1 Beaufort Gyre in safe rotation
Before I drop into the processing of the new datasets I mentioned (Databases Galore - 22), I want to finish up on this post in this series.

The graphic at Fig. 1 shows the safe counter-clockwise rotation of the Beaufort Gyre.

It also shows a general description of three general concept layers in the gyre.

The graphs (Fig. 2a - Fig. 6b) show the Conservative Temperature (CT) and Absolute Salinity (SA) at various depths over the years.

The Woods Hole Oceanographic Institute (WHOI) has been studying the phenomenon since 2003 (Beaufort Gyre Exploration Project), and providing data for us to use at no cost as I have explained (Mysterious Zones of The Arctic, 2).

Fig. 2a CT 50m - 100m
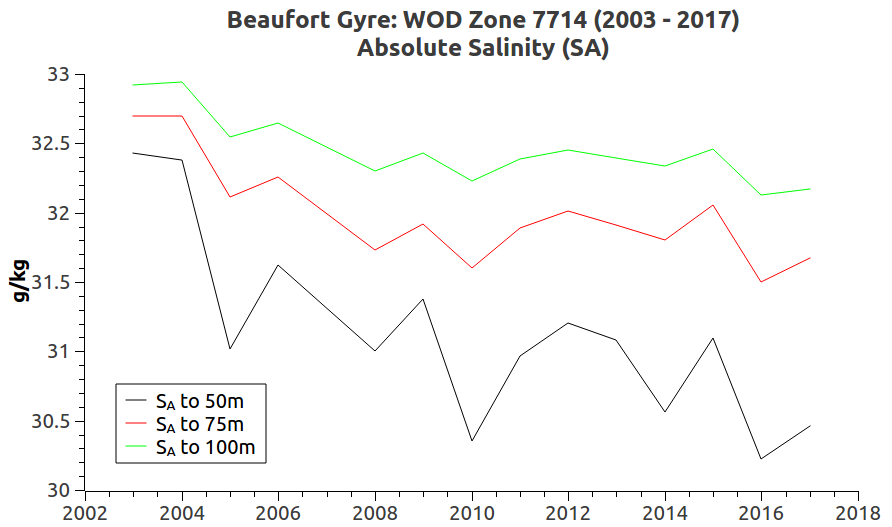
Fig. 2b SA 50m - 100m
The main issue of concern and mystery at this time is the direction of rotation, which is not the rotation shown in Fig. 1:
"When this ocean current spins clockwise [as it is now], it traps Arctic ice and freshwater melt. When it spins the other way [as in Fig. 1], it ejects that ice and freshwater out past Greenland into the North Atlantic, making weather in Northern Europe cooler. It is a natural phenomenon, but something has gone awry with the way it operates, as its periodic reversal is way overdue."
(Public Radio International (PRI), emphasis added). The general process of the gyre over time has been to change rotation periodically.

Fig. 3a CT 125m - 300m
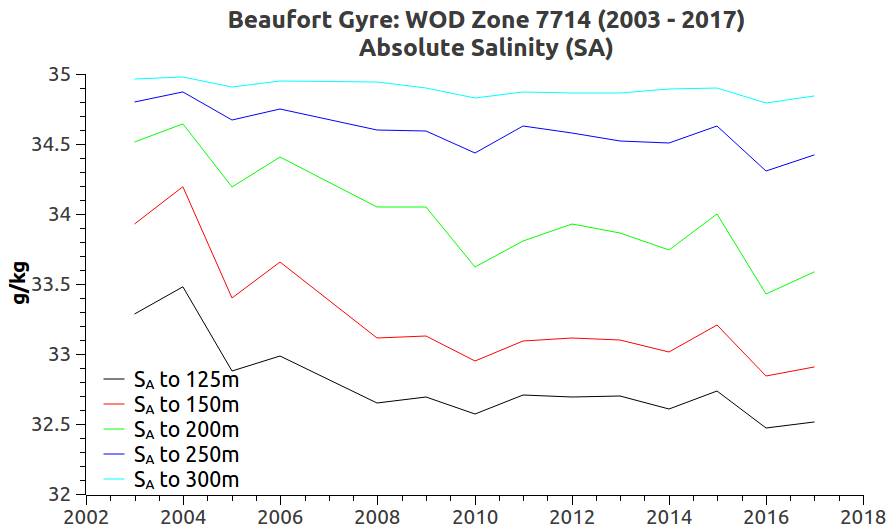
Fig. 3b SA 125m - 300m

Fig. 4a CT 400m - 800m
Fig. 4b SA 400m - 800m
But as PRI points out, things have changed and the outcome is somewhat uncertain.

In terms of time the change in rotation is overdue, but in terms of what will happen if it does change after being hung up so long is more clear.

It is likely to be bad for fishing in the North Atlantic because it is expected to cause a cooling of temperatures in some parts of Europe.

The study being done by the WHOI is spot on.

And as I have written in this series in earlier posts, their sharing of very good data is laudable.
Fig. 5a CT 900m - 1300m
Fig. 5b SA 900m - 1300m

Fig. 6a CT 1400m - 1750m
Fig. 6b SA 1400m - 1750m
Their scientists do not sugar coat the reality presented by their research:
"Today, the Beaufort Gyre holds as much freshwater as all of the Great Lakes combined, and its continuing clockwise swirl is preventing this enormous volume of ice and cold, fresh water from flushing into the North Atlantic Ocean. But, scientists say, the gyre will inevitably weaken and reverse direction, and when it does it could expel a massive amount of icy fresh water into the North Atlantic. Polar oceanographer Andrey Proshutinsky of the Woods Hole Oceanographic Institution has labeled this anticipated surge of water a “ticking climate bomb,” noting that even a partial flush of that growing reservoir — a mere 5 percent — could temporarily cool the climate of Iceland and northern Europe and have a major impact on commercial fisheries in the North Atlantic"
(Yale Environment 360, emphasis added). The mystery of the clockwise rotation hang-up continues.

That said, the content of the gyre at this time is not so mysterious, thanks to WHOI monitoring.

The paired graphs (Fig. 2a - Fig. 6b) of CT and SA at various depths generally indicates that the shallower depths contain cooler, fresher water, i.e., cooler temperatures (CT) and lower salinities (SA).

The mid-range depths have warmer water temperatures (CT) and increasing amounts of salinity (SA).

The deepest waters generally have cooler water, but more salinity.

We will keep an eye on this mysterious WOD Zone 7714 to find out what else, besides the cooling effect the expected reversal will have on Europe.

But we also need to watch the additional effect the flushing of the colder water will have on the already warming Arctic itself.

I need to close now and get to work on the new, enormous database I downloaded from the WOD (Databases Galore - 22).

Stay tuned.

The previous post in this series is here.

Databases Galore - 22

New Datasets
I have a new announcement concerning the World Ocean Database (WOD) used here on Dredd Blog.

In the past I have used only the CTD and PFL datasets to generate graphs and generally explore the world's oceans.

What is new is that I have downloaded all WOD data sets of in situ measurements:
Dataset    Description

OSD (O,S) Bottle, low resolution CTD and XCTD, and plankton data.
MBT (O,S) MBT, DBT, and Micro BT data.
CTD  (O,S) High resolution CTD data.
XBT  (O,S) Expendable bathythermograph data.
PFL   (O,S) Profiling float data.
MRB (O,S) Moored buoy data.
DRB  (O,S) Drifting buoy data.
APB  (O,S) Autonomous Pinniped Bathythermograph data.
UOR  (O,S) Undulating Oceanographic Recorder data.
GLD  (O,S) Glider data.
SUR  (O,S) Surface data only.
The "O" version of data means "observed" data, which is composed of measurements taken at random depths.

The "S" version of data means measurements taken at "standard" depths defined in the WOD Manual.

I combine all of them into 33 depths from 0-10 meters down to the deepest measurements (5,500 meters or more).

In the coming days I will be decompressing them (over 2,300 files totaling over 21 gigabytes compressed), translating the WOD format into CSV format, then placing them in an SQL server.

Stay tuned.

The next post in this series is here, previous post in this series is here.

Tuesday, September 11, 2018

Mysterious Zones of The Arctic - 2

Fig. 1 Location of Beaufort Gyre
I. Background

In the first post of this series I focused on ingress into the Arctic Ocean from both the Pacific and the Atlantic oceans (Mysterious Zones of The Arctic).

We saw that Pacific Ocean water made its way there through the Bering Sea and Bering Strait.

The Atlantic Ocean water made its way there by flowing north on the eastern side of Greenland (ibid).

The hypothesis in that post was that things have changed since the once-colder Pacific water is warming up and teaming up with already warmer Atlantic waters in the Beaufort Gyre.

The result of that mixing of the two warmer waters is possibly the cause of "multi-year ice" melt in the Lincoln Sea just north of Greenland.

Yes, even the multi-year ice is being impacted:
"Almost all of the ice to the north of Greenland is quite shattered and broken up and therefore more mobile," Ruth Mottram of the Danish Meteorological Institute told the Guardian. "Open water off the north coast of Greenland is unusual. This area has often been called 'the last ice area' as it has been suggested that the last perennial sea ice in the Arctic will occur here. The events of the last week suggest that, actually, the last ice area may be further west."
(Strongest, Oldest Arctic Sea Ice Breaks Up for First Time, emphasis added). It turns out that the Bering Sea is also very surprisingly free of ice:
"Winter sea ice cover in the Bering Sea did not just hit a record low in 2018; it was half that of the previous lowest winter on record (2001), says John Walsh, chief scientist of the International Arctic Research Center at the University of Alaska Fairbanks. “There’s never ever been anything remotely like this for sea ice” in the Bering Sea going back more than 160 years, says Rick Thoman, an Alaska-based climatologist with the National Oceanic and Atmospheric Administration.
...
But until recently the water there was reliably cold enough in autumn that when winds did blow from the north, sea ice would still spread. The last few years have seen unusually warm ocean waters in the Bering. Research meteorologist Nick Bond and others think this is “a lingering hangover” of a larger marine heat wave—dubbed “The Blob”—that lay off the west coast of the U.S. and Canadian mainland from 2014 to 2016. Bond, who works for NOAA’s Pacific Marine Environmental Laboratory, thinks some of those warm waters followed ocean currents up into the Bering and left a deep reservoir of warmth that impeded ice formation, although he has not yet formally studied this."
(Mysterious Zones of The Arctic, emphasis added). In that post I pointed out that I suspect that the Beaufort Gyre is a player in these events.

It seems that the Beaufort Gyre mixes the two ocean waters together more easily now that those waters are more alike in temperature and salinity.

Fig. 2a
Fig. 2b
Fig. 2c
Fig. 2d
II. Surprising Potential

The concern about the Beaufort Gyre is not only for the Greenland tidewater glaciers (Greenland 2.0, 2).

There is reason to be concerned even for climate impact on Europe (How a Wayward Arctic Current Could Cool the Climate in Europe).

Once again "sooner than expected" comes to mind (Early Collapse of Arctic Sea Ice Is Another Ominous Sign of Rapid Warming).

III. Close Monitoring Is In Order

At it turns out, the Beaufort Gyre is a mysterious place in WOD Zone 7714, which is unsurprisingly an area of intense interest and study by scientists (Beaufort Gyre Exploration Project, Scientists are keeping a close eye on the Beaufort Gyre).

As it also turns out, the Beaufort Gyre is not at all what I expected of Arctic waters, so I got busy finding more data with which to produce graphs.

I found that the Woods Hole Oceanography Institute has very good data of the location (Fig. 1).

They make it freely available in a very professional but easy-to-use way (Mooring Data Beaufort Gyre).

So I downloaded over 18,000 of their ".dat" files, then conformed them to the WOD data CSV format and placed them into a Dredd Blog SQL server database.

The 2018 data has not yet been posted online, but I will add that to the mix when it becomes available.

IV. The First Beaufort Gyre Graphs

In the first post of this series I did graphs of the zones at the entry way to the Arctic area where the Pacific and Atlantic waters flow north.

I haven't yet had time to do extensive graphing of the Gyre itself, as I did with those earlier graphs.

However, I furnished a peek with the graphs at Fig. 2a - Fig. 2d.

They show the dynamic of mixing as well as water at temperatures above freezing, with salinity increasing with depth.

This is a danger to sea ice in the Lincoln Sea, Arctic Ocean, and to the tidewater glaciers along the coast of Northern and Western Greenland.

V. Conclusion

Stay tuned if you like, I will have more detailed graphs of the mysterious Beaufort Gyre soon.

The next post in this series is here, the previous post in this series is here.