 |
| Don't stay in the shallows |
Why is ocean water (all of it, not just the surface) temperature important to the analysis of current and approaching sea level changes?
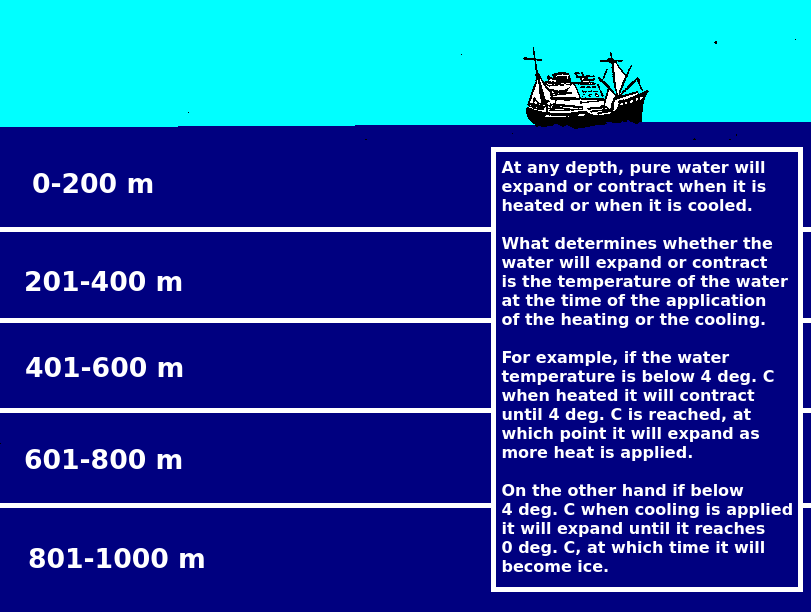
The current scientific commentariat is seized of the notion that the ocean, at any depth or temperature, can only expand (thermal expansion) if it is heated.
That is wrong, since fresh water does not follow that supposed rule, and neither does ocean water, which is different from fresh water only in the degree of temperature fluctuation that would cause either thermal expansion or thermal contraction.
Thus, we will consider the following quote from a peer reviewed paper as an answer to the question as to why the correct answer is so important:
Sea level is often conceived as being analogous to the depth of water in a bathtub, rising or falling everywhere as water is removed or added. The truth is far more complicated: sea level is more like the depth of water in a rotating, self-gravitating bathtub with wind and buoyancy fluxes at its surface; heterogeneous density; and a viscoelastic, deforming bottom. In other words, sea-level change is far from uniform.(Curr Clim Change Rep (2015) 1:192–204, emphasis added). In other words the answer is that millions of lives, at hundreds of local venues on coastlines around the world, depend on what public officials think that the present and the future of sea level rise is.
Sea level in the sense used here, also known as relative sea level (RSL), is defined as the difference in elevation between sea-surface height (SSH) and the height of the solid-Earth surface. SSH, also called geocentric sea level, is defined with respect to a reference ellipsoid. RSL—the parameter that matters for those communities and ecosystems on land at risk from coastal flooding—can be measured with tide gauges; SSH is measured with satellite altimetry. While in the global mean, the difference between these two measures of sea level is small, local differences in RSL and SSH changes can be quite significant.
...
RSL rise poses a risk to communities, ecosystems, and economies, through inundation and by influencing the frequency and magnitude of coastal flooding. This risk is geographically variable, as both RSL changes and socioeconomic exposure vary with location. Failure to account for the differences between RSL change and global-mean sea-level (GMSL) change can lead to either under- or over-estimation of the magnitude of the allowance necessary to accommodate RSL rise. Accordingly, stakeholders and agencies responsible for quantifying the flooding hazard require local RSL projections for risk assessment and decision-making.
If those officials get it wrong, then their efforts will not be protective of the lives of their constituents (The Extinction of Robust Sea Ports, 2, 3, 4, 5, 6, 7, 8, 9).
That extinction of sea ports series explains that you who live in the mid-west, far from the coastlines, are dependent on sea ports on the coast.
In fact, as goes the sea ports, so goes civilization (ibid).
In that context, the proper analysis of sea level change must, as the fundamental conceptual basis, know where the sea change originates (i.e. "what and where are the sources causing major sea level rise and fall?").
If that is not known, there can be no proper response to the dangers involved.
II. Probing the Depth Layers
As regular readers know, I have been analyzing ocean temperatures recorded in the World Ocean Database (WOD) with a layered approach, which means considering latitude layers that are equidistant from the Equator, but are nevertheless located in different hemispheres (The Layered Approach To Big Water, 2, 3, 4).
As that is done, we probe the depths under the surface (where most of the temperatures are), down to the bottom, or as deep as the WOD datasets go.
So far, layers 3, 4, 5, 6, 7, 8, 9, 10, 11, 12, 13, and 14 have been analyzed (layers 0, 1, 2, 15, 16, and 17 are yet to be done).
That analysis takes into consideration the sea level change in the particular layers being pondered.
III. The Bottom Line of the Analysis
The design of the analysis is to consider how much thermal expansion and contraction is involved at each layer, and by extension (since all of the worlds oceans are intended to be covered), how much total thermal expansion and contraction takes place in the whole of the oceans.
This approach is associated with the hypothesis that "most sea level change in the 19th and 20th centuries is caused by thermal expansion."
In other words, if that hypothesis is valid, then the observations should confirm it, or if the observations do not confirm it, then the hypothesis is falsified.
IV. Subsurface Analysis
Today, I am presenting the subsurface mean average temperature changes shown by the analysis at each layer completed so far.
NOTICE: the following values are NOT temperatures, they are CHANGES IN TEMPERATURE:
A. Layer Three
Combined averages for 23 total WOD Zones
(values are in deg. C)
Concerning change, the mean average
was 70 upward & 68 downward changes.
Average changes per depth level were:
- 0-200m = 0.337132
- 200-400m = 0.350664
- 400-600m = 0.192843
- 600-800m = 0.403621
- 800-1000m = 0.233676
- 1000-3000m = -0.0747387
- >3000m = -0.143417
Years involved: 1964 -> 2016 (52 yrs)
Average annual combined change:
- (1.29978 ÷ 52): 0.0249958 C per year
B. Layer Four
Combined averages for 25 total WOD Zones
(values are in deg. C)
Concerning change, the mean average
was 121 upward & 112 downward changes.
Average changes per depth level were:
- 0-200m = -0.11104
- 200-400m = -0.570763
- 400-600m = 0.287407
- 600-800m = 0.474306
- 800-1000m = 0.287892
- 1000-3000m = -0.482644
- >3000m = -0.543097
Years involved: 1961 -> 2016 (55 yrs)
Average annual combined change:
- (-0.65794 ÷ 55): -0.0119625 C per year
C. Layer Five
Combined averages for 28 total WOD Zones
(values are in deg. C)
Concerning change, the mean average
was 86 upward & 81 downward changes.
Average changes per depth level were:
- 0-200m = 0.571661
- 200-400m = -0.135107
- 400-600m = -0.148795
- 600-800m = -0.198917
- 800-1000m = 0.251496
- 1000-3000m = 0.35297
- >3000m = 0.20562
Years involved: 1961 -> 2016 (55 yrs)
Average annual combined change:
- (0.898927 ÷ 55): 0.0163441 C per year
D. Layer Six
Combined averages for 29 total WOD Zones
(values are in deg. C)
Concerning change, the mean average
was 76 upward & 76 downward changes.
Average changes per depth level were:
- 0-200m = -0.285655
- 200-400m = 0.771007
- 400-600m = 0.444982
- 600-800m = -0.450949
- 800-1000m = -0.554331
- 1000-3000m = -0.467585
- >3000m = -0.180126
Years involved: 1961 -> 2016 (55 yrs)
Average annual combined change:
- (-0.722657 ÷ 55): -0.0131392 C per year
E. Layer Seven
Combined averages for 32 total WOD Zones
(values are in deg. C)
Concerning change, the mean average
was 62 upward & 62 downward changes.
Average changes per depth level were:
- 0-200m = 0.247241
- 200-400m = 0.657138
- 400-600m = 0.249932
- 600-800m = 0.163198
- 800-1000m = -0.142136
- 1000-3000m = 0.275811
- >3000m = 0.147455
Years involved: 1961 -> 2016 (55 yrs)
Average annual combined change:
- (1.59864 ÷ 55): 0.0290662 C per year
F. Layer Eight
Combined averages for 33 total WOD Zones
(values are in deg. C)
Concerning change, the mean average
was 86 upward & 84 downward changes.
Average changes per depth level were:
- 0-200m = 0.493106
- 200-400m = -0.140973
- 400-600m = -0.230762
- 600-800m = -0.296653
- 800-1000m = -0.0763039
- 1000-3000m = 0.141082
- >3000m = -0.0025456
Years involved: 1956 -> 2016 (60 yrs)
Average annual combined change:
- (-0.11305 ÷ 60): -0.00188417 C per year
G. Layer Nine
Combined averages for 33 total WOD Zones
(values are in deg. C)
Concerning change, the mean average
was 87 upward & 83 downward changes.
Average changes per depth level were:
- 0-200m = 1.58264
- 200-400m = -0.117891
- 400-600m = -0.0053003
- 600-800m = -0.141808
- 800-1000m = -0.0996858
- 1000-3000m = -0.501599
- >3000m = 0.0590618
Years involved: 1962 -> 2016 (54 yrs)
Average annual combined change:
- (0.775414 ÷ 54): 0.0143595 C per year
H. Layer Ten
Combined averages for 33 total WOD Zones
(values are in deg. C)
Concerning change, the mean average
was 64 upward & 62 downward changes.
Average changes per depth level were:
- 0-200m = 0.733258
- 200-400m = 0.355852
- 400-600m = 0.26554
- 600-800m = 0.0905552
- 800-1000m = 0.0267342
- 1000-3000m = -0.388037
- >3000m = -0.202781
Years involved: 1967 -> 2016 (49 yrs)
Average annual combined change:
- (0.881121 ÷ 49): 0.0179821 C per year
I. Layer Eleven
Combined averages for 31 total WOD Zones
(values are in deg. C)
Concerning change, the mean average
was 59 upward & 58 downward changes.
Average changes per depth level were:
- 0-200m = 0.586313
- 200-400m = 0.350809
- 400-600m = -0.32785
- 600-800m = 0.124022
- 800-1000m = 0.0277168
- 1000-3000m = 0.101842
- >3000m = -0.283399
Years involved: 1961 -> 2016 (55 yrs)
Average annual combined change:
- (0.579453 ÷ 55): 0.0105355 C per year
J. Layer Twelve
Combined averages for 36 total WOD Zones
(values are in deg. C)
Concerning change, the mean average
was 63 upward & 63 downward changes.
Average changes per depth level were:
- 0-200m = 0.0850389
- 200-400m = 0.277614
- 400-600m = 0.0911808
- 600-800m = 0.115266
- 800-1000m = 0.204615
- 1000-3000m = 0.555147
- >3000m = -0.0581782
Years involved: 1962 -> 2016 (54 yrs)
Average annual combined change:
- (1.27068 ÷ 54): 0.0235312 C per year
K. Layer Thirteen
Combined averages for 36 total WOD Zones
(values are in deg. C)
Concerning change, the mean average
was 72 upward & 67 downward changes.
Average changes per depth level were:
- 0-200m = 0.627579
- 200-400m = 0.6432
- 400-600m = 0.578951
- 600-800m = 0.554063
- 800-1000m = 0.235429
- 1000-3000m = 0.492931
- >3000m = 0.133829
Years involved: 1956 -> 2016 (60 yrs)
Average annual combined change:
- (3.26598 ÷ 60): 0.054433 C per year
L. Layer Fourteen
Combined averages for 36 total WOD Zones
(values are in deg. C)
Concerning change, the mean average
was 93 upward & 71 downward changes.
Average changes per depth level were:
- 0-200m = 0.307199
- 200-400m = 0.113274
- 400-600m = 0.18116
- 600-800m = 0.0422305
- 800-1000m = 0.0593068
- 1000-3000m = 0.0909547
- >3000m = 0.0135098
Years involved: 1956 -> 2016 (60 yrs)
Average annual combined change:
- (0.807635 ÷ 60): 0.0134606 C per year
V. Conclusion
Thus, in the layers considered so far, the average for all 12 layers is 0.19570423 degrees C. (0.19570423 / 12 = 0.016308686).
The total years spanned by all 12 layers is 664 yrs; 664 / 12 = 55.33 yrs., so 55.33 × 0.016308686 = 0.9024 degrees total increase in temperature for all layers over the 55.33 years so far analyzed (the atmospheric temperature increase is a bit more than that).
Since we are now approaching the colder layers (Arctic, Antarctic) that 0.9024 deg. C total increase in ocean water temperature may not hold up.
Anyway you want it, the major source for changes in sea level is still looking to be the melting and disintegration of the cryosphere, not thermal expansion.
Stay tuned.
The next post in this series is here, the previous post in this series is here.
No comments:
Post a Comment