Saturday, April 14, 2018

Antarctica 2.0 - 6


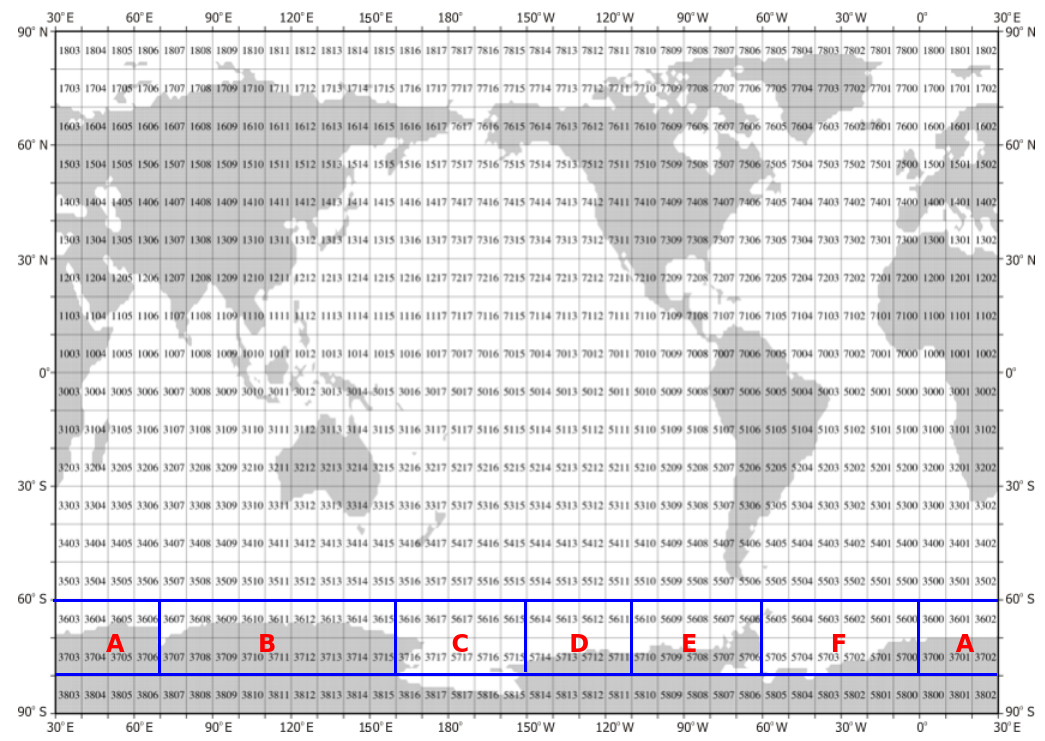
Fig. 1 Six 'subdivisions' of Southern Ocean
I. Background

I wondered about the size of the WOD Zones that reach around the Earth at 60 degrees South Latitude.

And I wondered about the six subdivisions ('A' though 'F' @ Fig. 1) of the Southern Ocean that also reach around the Earth at 60 degrees South Latitude

So I calculated the width of those subdivisions, and the distance around the globe at 60 deg. South Latitude, using some algorithms in my latitude/longitude distance calculation toolbox:

The following distances, in kilometers (km) and miles (mi) resulted:
Area A [W. Indian] width = 3,889 km (2,430 mi)
Area B [E. Indian] width = 5,000 km (3,125 mi)
Area C [Ross] width = 2,778 km (1,736 mi)
Area D [Amundsen] width = 2,222 km (1,389 mi)
Area E [Bellingshausen] width = 2,778 km (1,736 mi)
Area F [Weddell] width = 3,333 km (2,083 mi)

Circumference = 19,998 km (12,499 mi)
(all minus factor of dist. from lat zero)
This inquiry was necessary because this post in this series is offered to show some systemic dynamics in the Southern Ocean (the names given to areas 'A' through 'F' are for sections of the Southern Ocean where the ocean water makes contact with Antarctica).

Noticing the size of the areas of Antarctica where tidewater glaciers touch the Southern Ocean, and events taking place there over half a century, will help expose patterns as well as showing us key events taking place over distances of thousands of kilometers.

The patterns that show up in graphs that represent thousands of kilometers will dispel the notion of certain local phenomena being a significant cause of melt over the vast tidewater glacier outlets around the vast continent of ice.

Let's remember that a focus on the Southern Ocean around Antarctica is a focus on the big picture:
"The vast Southern Ocean, which surrounds Antarctica, plays a starring role in the future of climate change. The global oceans together absorb over 90 percent of the excess heat in the climate system and roughly three-quarters of that heat uptake occurs in the Southern Ocean. In addition, the global oceans absorb around 25 percent of anthropogenic carbon dioxide emissions and the Southern Ocean alone accounts for about half of the uptake of CO2.

Despite its critical role in our climate system, the Southern Ocean has gone almost completely unobserved. Scientists have struggled to gather precise measurements because of the harsh environment and extreme remoteness. The changing dynamics of the Southern Ocean will in turn drive key aspects of our future climate, including how sensitive the Earth will be to further warming and increases in carbon dioxide emissions. As a result, improved observations are crucial to helping scientists understand and predict how our climate will change."
(Antarctica 2.0 - 3, quoting Climate Central). It is like the situation when the detective asked the bank robber "Why do you rob banks?" and the bank robber replied "That is where the money is" (Antarctica is where the greatest Cryosphere changes are).

II. Focus On What?

There are two approaches to explaining the massive changes taking place in Antarctica's tidewater glaciers.

One of those approaches has a limited or narrow outlook or scope, as exemplified by this paper (Wind Causes Totten Glacier Melt).

Why one glacier would melt because of surface wind and others would not is a suspicious hypothesis, plus the WOD Zone records do not show what the authors "thought to be driven by a variable supply of warm, salty, modified circumpolar deep water" (ibid).

The graphs (discussed below) based on in situ ocean water temperatures do not bear that out.

Another approach links global events into the causation picture (AMOC Weakens, Same), and yet another targets other currents (Carbon Brief).

Those and other global events have an impact on the Southern Ocean:
"Researchers have been worried about an Atlantic slowdown for years. The Atlantic serves as the engine for the planet’s conveyor belt of ocean currents: The massive amount of cooler water that sinks in the North Atlantic stirs up that entire ocean and drives currents in the Southern and Pacific oceans, too. “It is the key component” in global circulation, says Ellen Martin, a paleoclimate and ocean current researcher at the University of Florida. So when the Atlantic turns sluggish, it has worldwide impacts: The entire Northern Hemisphere cools, Indian and Asian monsoon areas dry up, North Atlantic storms get amplified, and less ocean mixing results in less plankton and other life in the sea."
(How Climate Change Could Jam Ocean Circulation, emphasis added). There is a reason to look for global sources of impact on the Southern Ocean.

Local phenomena have a local (limited) impact, so they are not as likely to be a significant cause of continent-wide changes.

III. Focus How?

I am providing a way to look at this problem by using the smallest unit, the WOD Zone.

I have graphed each WOD Zone of each of the six areas ('A' - 'F') that contain WOD / SOCCOM data.

Those graphs, since there are many of them, are placed in posts that are concurrent with, and supportive of this post (links to those area graphs: A, B, C, D, E, F).

IV. Temperatures At Which Tidewater Glaciers Melt

I have shown, using the latest official oceanographic toolkit (TEOS-10), that glacial ice deep down melts at very cold temperatures (Hot, Warm, & Cold Thermal Facts: Tidewater-Glaciers, see "IV. TEOS-10 Functions" in that post).

There is no need for "warm" water as the temperatures in the graphs show.

Most temperatures are under 2 deg. C (35.6 deg. F), and the "warmest" is near 4 deg. C (39.4 deg. F).

The paper cited in section II ("Wind Causes Totten Glacier Melt") concerns area 'B' which does not reach over 2 deg. C like areas 'C' and 'D' do.

V. Conclusion

"Warm" water does not cause tidewater glaciers to melt around Antarctica.

It is caused by less-cold water touching submerged and colder glacial ice.

The Second Law of Thermodynamics holds that when there is an energy imbalance causing one mass to be at a higher temperature than the other mass it is in contact with, the energy will flow from the mass with the higher temperature into the mass with the lower temperature until equilibrium is reached.

Salinity and pressure also play a role as to how that plays out in terms of when that flow causes the glacial ice to melt.

I will continue to refer to the concurrent posts ('A' through 'F') in future posts on this matter.

The next post in this series is here, the previous post in this series is here.

A - West Indian Ocean

This page consists of supplemental data to the main post: Antarctica 2.0 - 6.

The first section below is composed of links to glaciers within the WOD Zones in this area (those zones are within the blue lines at the bottom of this WOD Zone map).

The second section is composed of graphs of sea water temperature mean averages at three main depths (0-700 m, >700 m to 2000 m, and >2000 m).

The final section is is composed of two graphs which are the combined mean average CT & melt CT (temperatures) of all zones in this Southern Ocean area.

(Click on the links to glaciers for a Wikipedia description of when they were discovered, how they were named, size, location, etc.).


West Indian Ocean (area 'A')


WOD Zone [3604]
Akebono, Assender, Ichime, Kichenside, Rayner, Shinnan

WOD Zone [3605]
Auster, Beaver (Enderby_Land), Rippon, Robert, Seaton, Wilma

WOD Zone [3606]
Utstikkar

WOD Zone [3700]
Austreskorve, Ising, Jutulstraumen, Sandhohallet, Sigyn, Skalebreen, Tonnesen, Vestreskorve

WOD Zone [3701]
Altarduken, Anuchin, Asimutbreen, Barkov

WOD Zone [3702]
Gillock

Area 'A' - WOD Zone 3600

Area 'A' - WOD Zone 3601

Area 'A' - WOD Zone 3602

Area 'A' - WOD Zone 3603

Area 'A' - WOD Zone 3604

Area 'A' - WOD Zone 3605

Area 'A' - WOD Zone 3606


The following two graphs are the combination (mean average) of all measurements from the zone graphs above:

Water Temperatures
Melt Temperatures


Go to Area 'B'

B - East Indian Ocean

This page consists of supplemental data to the main post: Antarctica 2.0 - 6.

The first section below is composed of links to glaciers within the WOD Zones in this area (those zones are within the blue lines at the bottom of this WOD Zone map).

The second section is composed of graphs of sea water temperature mean averages at three main depths (0-700 m, >700 m to 2000 m, and >2000 m).

The final section is is composed of two graphs which are the combined mean average CT & melt CT (temperatures) of all zones in this Southern Ocean area.

(Click on the links to glaciers for a Wikipedia description of when they were discovered, how they were named, size, location, etc.).

East Indian Ocean (area 'B')


WOD Zone [3607]
Il Polo, Polar Times, Polararboken, Sorsdal

WOD Zone [3608]
Posadowsky (Antarctica)

WOD Zone [3609]
Burton Island, Denman, Northcliffe

WOD Zone [3610]
Adams (Wilkes_Land), Apfel, Scott (East_Antarctica), Underwood

WOD Zone [3611]
Gilchrist, Totten, Vanderford

["the Totten Glacier is thinning and its grounding line is retreating"; "Totten Glacier, East Antarctica, a single glacier that holds a 3.9 m (12.8 feet) sea level change equivalent, has thinned and lost mass for decades."]

WOD Zone [3612]
Frost

WOD Zone [3613]
Astrolabe, Barre, Dibble

WOD Zone [3614]
Mertz, Ninnis, Zelee

WOD Zone [3615]
Noll


Area 'B' - WOD Zone 3607

Area 'B' - WOD Zone 3608

Area 'B' - WOD Zone 3609

Area 'B' - WOD Zone 3610

Area 'B' - WOD Zone 3611

Area 'B' - WOD Zone 3612

Area 'B' - WOD Zone 3613

Area 'B' - WOD Zone 3614

Area 'B' - WOD Zone 3615


The following two graphs are the combination of all measurements (mean average) from the zone graphs above:

Water Temperatures
Melt Temperatures


Go to Area 'A' ... or ... Go to Area 'C'

C - Ross Sea

This page consists of supplemental data to the main post: Antarctica 2.0 - 6.

The first section below is composed of links to glaciers within the WOD Zones in this area (those zones are within the blue lines at the bottom of this WOD Zone map).

The second section is composed of graphs of sea water temperature mean averages at three main depths (0-700 m, >700 m to 2000 m, and >2000 m).

The final section is is composed of two graphs which are the combined mean average CT & melt CT (temperatures) of all zones in this Southern Ocean area.

(Click on the links to glaciers for a Wikipedia description of when they were discovered, how they were named, size, location, etc.).


Ross Sea (area 'C')


WOD Zone [3716]
Adams (Victoria_Land), Aeronaut, Aiken, Alberich, Albrecht Penck, Allison (Antarctica), Alvarez, Amos, Amphitheatre, Anderton, Ant Hill, Anu Whakatoro, Argonaut, Arruiz, Astakhov, Astapenko, Astronaut, Atka, Atkinson, Aurora (Antarctica), Aviator, Backstairs Passage, Baker, Ball (Victoria_Land), Barber, Barne, Barnett, Baronick, Bartley, Bates, Baxter, Beaman, Blankenship, Borchgrevink, Canada, Clarke (Victoria_Land), Co-pilot, Commonwealth, Coulston, Crescent (Antarctica), Crume, Dale, David, Debenham, Decker, Deming, Dennistoun, Ebbe, Emmanuel, Endeavour Piedmont, Erebus, Falkner, Ferrar, Finley, Fitch, Gair, Garwood, Greenwell, Haffner, Helfferich, Icebreaker, Ironside, Irving (Antarctica), Irwin, Kirkby, Koettlitz, Lillie, Lovejoy, Marchant, Marchetti, Marin, Mariner, Meander, Nash, Newall, Northwind, Oakley, O%27Hara, Pilot, Priddy, Priestley, Pryor, Puanu, Rennick, Robson (Antarctica), Shark Fin, Sharpend, Sheehan, Shell, Shipley, Shoemaker, Simpson, Skelton, Suess, Suter, Taylor, Telemeter, Tucker, Vacchi Piedmont, Vereyken, Wirdnam, Wright Lower, Zenith, Zetland, Zoller, Zykov

WOD Zone [3717]
Arneb, Bornmann, Bridgman


Area 'C' - WOD Zone 3616

Area 'C' - WOD Zone 3617
Area 'C' - WOD Zone 3717
Area 'C' - WOD Zone 5615

Area 'C' - WOD Zone 5616

Area 'C' - WOD Zone 5617

Area 'C' - WOD Zone 5715

Area 'C' - WOD Zone 5716

Area 'C' - WOD Zone 5717


The following two graphs are the combination of all measurements (mean average) from the zone graphs above:

Water Temperatures
Melt Temperatures


Go to Area 'B' ... or ... Go to Area 'D'

D - Amundsen Sea

This page consists of supplemental data to the main post: Antarctica 2.0 - 6.

The first section below is composed of links to glaciers within the WOD Zones in this area (those zones are within the blue lines at the bottom of this WOD Zone map).

The second section is composed of graphs of sea water temperature mean averages at three main depths (0-700 m, >700 m to 2000 m, and >2000 m).

The final section is is composed of two graphs which are the combined mean average CT & melt CT (temperatures) of all zones in this Southern Ocean area.

(Click on the links to glaciers for a Wikipedia description of when they were discovered, how they were named, size, location, etc.).

("The Antarctic Ice Sheet is losing mass at an increasing rate ... with the largest loss observed in glaciers that flow into the Amundsen Sea")

("... the Amundsen Sea Embayment of West Antarctica [is] an area experiencing rapid retreat and mass loss to the sea.")

Amundsen Sea (area 'D')


WOD Zone [5711]
Beakley, Kohler, McClinton, Simmons, Smith, Yoder, Zuniga

WOD Zone [5713]
Berry, Clarke (Marie_Byrd_Land), DeVicq, Jacoby, Shuman, Venzke

WOD Zone [5714]
Anandakrishnan, Arthur, Balchen, Crevasse Valley, El-Sayed, Hammond, Jacobel, Land, MacAyeal Ice_Stream, Siemiatkowski


Area 'D' - WOD Zone 5611

Area 'D' - WOD Zone 5612

Area 'D' - WOD Zone 5613

Area 'D' - WOD Zone 5614

Area 'D' - WOD Zone 5711

Area 'D' - WOD Zone 5712

Area 'D' - WOD Zone 5713

Area 'D' - WOD Zone 5714


The following two graphs are the combination of all measurements (mean average) from the zone graphs above:

Water Temperatures
Melt Temperatures


Go to Area 'C' .... or .... Go to Area 'E'

E - Bellingshausen Sea

This page consists of supplemental data to the main post: Antarctica 2.0 - 6.

The first section below is composed of links to glaciers within the WOD Zones in this area (those zones are within the blue lines at the bottom of this WOD Zone map).

The second section is composed of graphs of sea water temperature mean averages at three main depths (0-700 m, >700 m to 2000 m, and >2000 m).

The final section is is composed of two graphs which are the combined mean average CT & melt CT (temperatures) of all zones in this Southern Ocean area.

(Click on the links to glaciers for a Wikipedia description of when they were discovered, how they were named, size, location, etc.).


Bellingshausen Sea (area 'E')


WOD Zone [5606]
Agalina, Ahlmann, Airy, Alberts, Altimir, Ambergris, Antevs, Anthony, Aphrodite, Apollo, Arago, Archer, Argentina, Armira, Astudillo, Athene, Attlee, Avsyuk, Bader, Bagshawe, Balch, Barnes, Bayly, Beaglehole, Berkovitsa, Bistra, Bolton, Boyana, Bozhinov, Butamya, Chernomen, Chumerna, Chuprene, Clarke (Graham_Land), Dalgopol, Debelt, Dimkov, Djerassi, Dragoman, Drygalski (Antarctica), Finsterwalder, Flask, Franca, Gramada, Grigorov, Haefeli, Ice Gate, Iliad, Kaliakra, Kamchiya, Kleptuza, Kolosh, Kongur, Krapets, Krivodol, Landreth, Lawrie, Leonardo, Leppard, Letnitsa, Lewis (Antarctica), Lipen, Lliboutry, Lurabee, Martin, Medven, Mitev, Muldava, Nadjakov, Nesla, Northeast, Nueve de_Julio, Ovech, Panega, Pashuk, Pastra, Perunika, Peshtera, Pimpirev, Pirin, Pirogov, Poduene, Prespa, Prospect, Quartermain, Renaud, Rhesus, Rose Valley, Rupite, Rusalka, Samodiva, Saparevo, Sedgwick, Shambles, Sharp, Sheldon, Shoesmith, Sigmen, Sikorsky, Skorpil, Solch, Solun, Srebarna, Struma, Suarez, Sunfix, Talev, Thamyris, Toynbee, Tumble, Tundzha, Urdoviza, Verila, Vetrino, Vidbol, Wager, Yablanitsa, Zephyr, Zimzelen, Zonda

WOD Zone [5607]
Bartok, Bishop, Clarsach, Coulter, Delius, Foreman, Gerontius, Gilbert, Hampton, Iliev, Lennon, McManus, Mikado, Moran, Narechen, Palestrina, Paulus, Rosselin, Sibelius, Siegfried, Sullivan, Walter, Wubbold, Yozola

WOD Zone [5706]
Armstrong, Barcus, Eros, Gain, Grotto, Irvine, Jupiter, Ketchum, Mars, Mercury, Neptune, Pluto, Saturn, Shabica, Transition, Trench, Ueda, Uranus, Utopia, Venus, Vivaldi, Wetmore, Yates

WOD Zone [5707]
Alyabiev, Arensky, Asafiev, Evans Ice_Stream, Holoviak, Hushen, Rachmaninoff, Reuning, Varlamov

WOD Zone [5708]
Ahrnsbrak, Arapya, Balish, Bolgrad, Branscomb, Carey, Dater, Driscoll, Ellen, Embree, Fendorf, Flanagan, Minnesota, Newcomer, Nimitz, Obelya, Remington, Roche, Rumyana, Rutford Ice_Stream, Schneider, Sirma, Thomas, Union, Williams Ice_Stream, Young

WOD Zone [5709]
Exum, Gopher, Haskell, Long, Pelter, Pine Island, Sikorski, Walk, Zinberg

WOD Zone [5710]
Acosta, Cox, Hale, Isbrecht, Myers, Thwaites ("If Thwaites Glacier goes, so might the entire West Antarctic Ice Sheet. Thwaites has long been recognized as a linchpin for the massive expanse, which covers an area the size of Mexico and could unleash more than three meters [9.8 feet] of sea level rise were it all to melt." - Scientific American)


Area 'E' - WOD Zone 5606

Area 'E' - WOD Zone 5607

Area 'E' - WOD Zone 5608

Area 'E' - WOD Zone 5609

Area 'E' - WOD Zone 5610

Area 'E' - WOD Zone 5706

Area 'E' - WOD Zone 5707

Area 'E' - WOD Zone 5708

Area 'E' - WOD Zone 5709

Area 'E' - WOD Zone 5710


The following two graphs are the combination of all measurements (mean average) from the zone graphs above:

Water Temperatures
Melt Temperatures


Go to Area 'D' ... or ... Go to Area 'F'