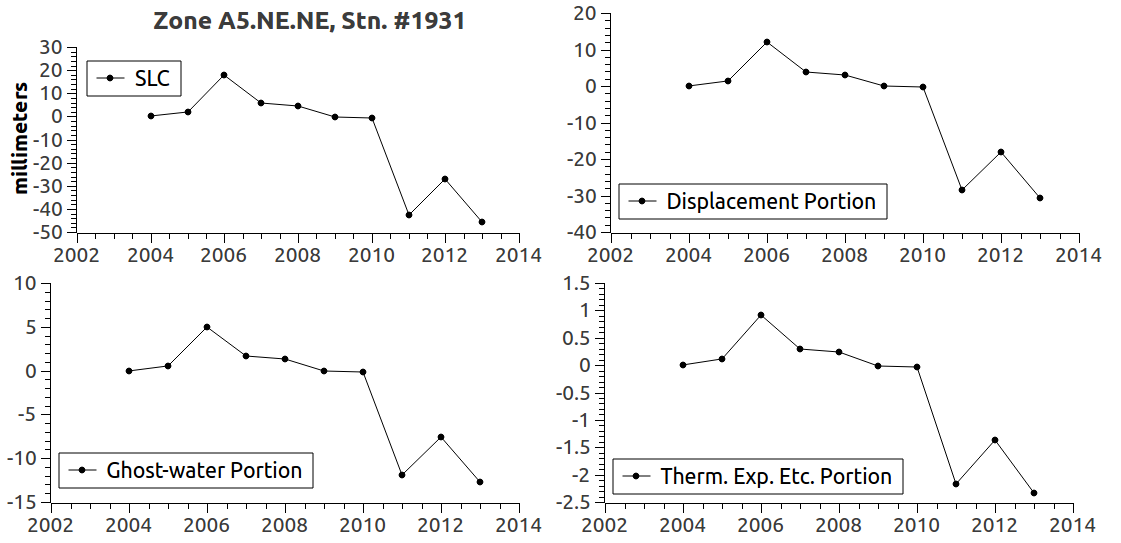
Friday, March 18, 2016

Zone AL, Quadrant SW, Sub-quadrant SW

Fig. 1
The geographical area we look at today has 71 PSMSL tide gauge stations, 120 GISS weather stations, and 100 seaports.

One of those seaports is the busiest in the whole world (Shanghai).
Fig. 2

The graph at Fig. 1 shows that the area is a high sea level rise area.

Which does not bode well for those seaports (The Extinction of Robust Sea Ports, 2, 3).

From 1940 - 2012 the SLR increase was 278 mm (~11 inches).

The temperature did not have a direct affect on the sea level there (Fig. 2), in terms of thermal expansion.

But the global warming heated the oceans enough to melt ice sheets from below the surface, as well as from the atmosphere above  (Is A New Age Of Pressure Upon Us? - 8).

The next foot or two of sea level rise will take about half of that time.

The past few months have been crazy hot, in fact hotter than all other months in all of modern history:
"The combined average temperature over global land and ocean surfaces for February 2016 was the highest for February in the 137-year period of record, at 1.21°C (2.18°F) above the 20th century average of 12.1°C (53.9°F). This not only was the highest for February in the 1880–2016 record—surpassing the previous record set in 2015 by 0.33°C / 0.59°F—but it surpassed the all-time monthly record set just two months ago in December 2015 by 0.09°C (0.16°F). Overall, the six highest monthly temperature departures in the record have all occurred in the past six months. February 2016 also marks the 10th consecutive month a monthly global temperature record has been broken."
(NOAA, Global Analysis - February 2016, emphasis added). Get ready for the doubling of sea level change.

With the crazoids wanting power so they can carpet bomb or nuke other nations, we also face a global cooling (Nuclear Winter, PDF).

You may wonder why warm melting ice and nuclear war winter are both subjects in this high sea level rise zone, which also contains the world's busiest seaport.

Note that Hiroshima and Nagisaki are both in this sub-quadrant (AL.SW.SW).

One side is ice, the other is fire up on this tight rope.

We never did make it here did we  (You Are Here) ?

Tight Rope


Thursday, March 17, 2016

Is A New Age Of Pressure Upon Us? - 8

Fig. 1
The next post will deal with sea level change where major world ports are located, but today we look at Antarctica once again.

Tide gauge stations in that harsh environment are rare compared to less harsh environments.

The new tide gauge record databases I downloaded have some tide gauge data that can be used for pondering sea level events there.

The graph at Fig. 1 concerns data at Almirante Brown Station 858 on the West Antarctic Peninsula.

It stopped being a station circa 1980.

Fig. 2
The graph at Fig. 4 is another Antarctic tide gauge station Argentine Islands, #913.
 as is Fig. 7, which is Rothera, Stn. #1931.
Fig. 3

Fig. 4
Those links to the PSMSL site contain maps that can be minimized until other gauges in the vicinity become visible.
Fig. 5

Fig. 6
All in all, they indicate in general, like records for the Greenland area do, that areas of sea level fall occur near large ice sheets as those ice sheets melt (e.g. Proof of Concept  3, 5).
Fig. 7

Fig. 8
The big story these days is that Antarctica and Greenland are melting underneath the surface at surprising depths.

If you take a look at Fig. 10 you will see that the warmest water under the Antarctic ice shelves is at a depth of about 400 meters (~1,312 feet).
Fig. 9

Recent articles (h/t reader Mark Hanson) indicate that the melt "works its way" through weak areas in the ice shelves as the warm water is pulled upward by, among other things, the ice sheet gravity: "The cause is not warming air temperatures, as Mercer had suspected, but rather warmer ocean waters reaching the base of the coastal glaciers – which are rooted hundreds of meters below sea level – and melting them from below." (Washington Post).

Reliance on the Bathtub Model and the Thermal Expansion myths have mislead a lot of researchers.

The implications and impacts of that misdirection have allowed a threat to civilization itself to develop (Why Sea Level Rise May Be The Greatest Threat To Civilization, 2, 3, 4, 5),
Greenland & Antarctica Invade The United States, 2, 3, 4).

However, the science on record may be forcing researchers to  abandon those myths ("... we conclude that most of the change in ocean mass is caused by the melting of polar ice sheets and mountain glaciers (Satellite data study, cf. Nature Geoscience).

The latter paper has a phrase in it that I hope to use in place of "bullshit" in the future, so as to "sound more scientific."

That spot-on phrase to replace the phrase "mythological bullshit" is: "the bleeding of terrestrial signals into the ocean data" (ibid).
Fig. 10 GISS data

Anyway, the situation is quite serious because the Thwaites Glacier, mentioned in that literature, is now problematic in several ways.

I wrote about it in the geothermal context a while back.

A quote from one of the papers I cite to in one of those posts presents this concern:
"Thwaites Glacier is one of the West Antarctica’s most prominent, rapidly evolving, and potentially unstable contributors to global sea level rise. Uncertainty in the amount and spatial pattern of geothermal flux and melting beneath this glacier is a major limitation in predicting its future behavior and sea level contribution. In this paper, a combination of radar sounding and subglacial water routing is used to show that large areas at the base of Thwaites Glacier are actively melting in response to geothermal flux consistent with rift-associated magma migration and volcanism. This supports the hypothesis that heterogeneous geothermal flux and local magmatic processes could be critical factors in determining the future behavior of the West Antarctic Ice Sheet"
(Is A New Age Of Pressure Upon Us? - 6). That post refers to some recent cases in Iceland where glacial thinning triggered volcanic activity which further degraded ice mass.

The next post in this series is here, the previous post in this series is here.

Tuesday, March 15, 2016

The Battle of the Bulge

Fig. 1
The Earth bulges at the equator.

It does so to the degree that the planet is twenty six and a half miles bigger-around at the equator than it is at the poles (Equatorial Bulge).

It is like that because the planet is rotating (spinning) at about 1,040 mph, which pulls or pushes ocean water, among other things, toward the equator to produce a bulge (Earth's Rotation).
Fig. 2

Evidently it is not widely known that this rotational dynamic impacts upon sea level change.

For today's post I did some graphs based on sea level change records at or near the equator.

The graphs at Fig. 2, Fig. 3, and Fig. 4 show that significant sea level dynamics take place there.

But, like other places it is not a perfectly smooth globe there, so as graphs in Dredd Blog posts show, sea level change varies from place to place.
Fig. 3

The melt water entering the ocean, and the ghost-water already in the ocean at Greenland, Antarctica, and Glacier Bay for example, are pulled or pushed toward the equator, i.e., toward the bulge.

Not many people know that when melt water and ghost-water leave those areas, the sea level there falls as that water flows in the direction of the Earth's bulge as indicated in Fig. 1 (The Ghost-Water Constant, 2, 3, 4).

In other words, there is a tension between the rotational pull and ice sheet gravity pull that is rarely considered (ibid).
Fig.4

The "point" where the two conflicting pulls equalize is called the "hinge point" or hinge line (The Evolution and Migration of Sea Level Hinge Points).

As the ice sheet loses mass it also axiomatically loses a directly related amount of its gravitational power.

Thus, as the Earth's rotational power becomes predominant and pulls the ghost-water away from the ice sheet area, the sea level falls around the land mass upon which the ice sheet rests (The Gravity of Sea Level Change).

It is quite clear to me that thermal expansion, land subsidence, and the like, are not major players in the sea level change scenario.

They are all minor players in sea level change.

The graphs at Fig. 3 and Fig. 4 show my hypothesis as to what the origins of sea level change are (after fossil fuels are burned).

The primary factor is displacement caused by ice sheet melt and calving as the ice sheet relocates from a land mass and flows into the ocean.

Next in significance is the release of ghost-water which had been held up close to the land mass by ice-sheet gravity.

Last and least is thermal expansion, etc. which is erroneously considered to be a or the major player by many who are unaware of all of the forces at play.

It is about time for the warming science commentariat to get modern.

As soon as they realize that they have been spreading a myth or two around the globe, and stop doing so, we will all be better off for it  (The Warming Science Commentariat, 2).

Their bathtub model myth is not doing anyone any good (The Bathtub Model Doesn't Hold Water).

In the next post or so of this series I intend to use major seaport zones and Antarctica zones (if those zones have tide gauge and other required data) in those zones as readers have requested.