Friday, January 17, 2025

The Photon Current - 20

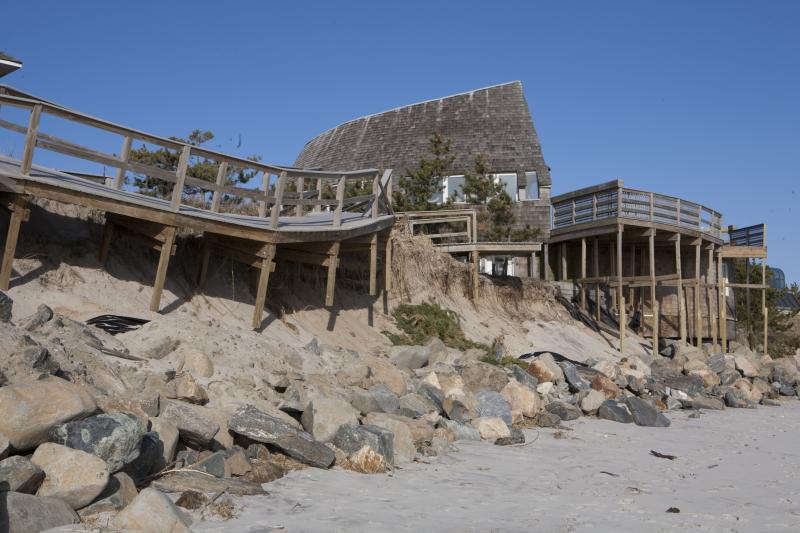
Fig. 1 Stairway to hell?
In Episode 15 of this series I suggested that if the Second Law of Thermodynamics was not operational serious temperature changes would be observed in the upper ocean depth levels.

The GISSTEMP dataset values were used to illustrate the point being made (Fig. 1).

The thought came to mind that perhaps the phenomenon of The Photon Current could be altered by physical factors which alter the operations of the Second Law of Thermodynamics.

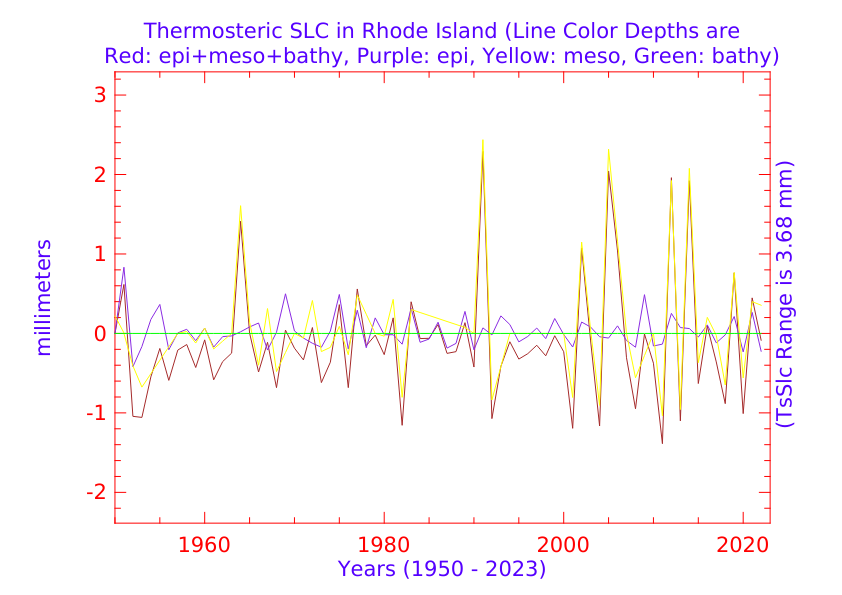
Remembering the contrast drawn between Fig. 1 and Fig. 2 discussed in Episode 15, a quickie supposition came to my mind, which was "heat saturation?".

Fig. 2 Thank you 2nd Law

So, I posed the following question to the Google AI algorithm:

"What factors determine at what temperature, pressure, salinity, and depth infrared photons in molecules of seawater will radiate to a molecule in cooler seawater near it?"


In that aforesaid episode I was in the state of mind of being appreciative of the operation of the Second Law of thermodynamics.

That is because the climate impact to global temperatures if it was not in existence would be catastrophic.

The surprising increase in global temperatures would be one event that would take place if the oceans became somehow "saturated" with heat to the  point of not absorbing as much or even radiating the heat into the atmosphere instead of radiating it as a photon current downward to previously cooler water.

Anyway, here is what "AI dood" had to "say" ...

AI Overview

The factors determining at what temperature, pressure, salinity, and depth infrared photons will move to a molecule in colder water are primarily the water molecule's vibrational and rotational energy levels, which are influenced by temperature and pressure, as well as the presence of dissolved salts (salinity) that can further affect the absorption spectrum; essentially, colder water with higher pressure and salinity will absorb infrared photons at slightly different wavelengths due to changes in molecular interactions and density.

Key points to consider:
Temperature:
As water cools, its molecules have less kinetic energy, leading to a shift in the absorption spectrum towards longer infrared wavelengths due to increased hydrogen bonding between water molecules.

Pressure:
Increasing pressure compresses water molecules closer together, slightly altering their vibrational modes and influencing the absorption of infrared radiation.

Salinity:
Dissolved salts in seawater can introduce additional absorption peaks in the infrared spectrum, further affecting how infrared photons interact with water molecules.

Depth:
As you go deeper in the water column, the pressure increases, which can slightly influence the absorption of infrared radiation.

How it works:

Molecular vibrations:
When infrared photons hit a water molecule, they can be absorbed if their energy matches the energy required to excite a vibrational mode (like bending or stretching) within the molecule.

Absorption spectrum:
Each molecule has a unique absorption spectrum, which shows which wavelengths of infrared radiation it readily absorbs.

Changes in molecular interactions:
Factors like temperature, pressure, and salinity can alter the interactions between water molecules, causing shifts in the absorption spectrum.

Important considerations:

Water is a strong absorber of infrared radiation:
Most infrared radiation is absorbed within the top few centimeters of the water column.

Wavelength dependence:
Different wavelengths of infrared radiation penetrate to varying depths in water, with longer wavelengths being absorbed closer to the surface.

(Thank you Mr. AI dood). Always remember that AI can be political, and that the use of current textbook knowledge is habitual with Mr. AI dood.

Which makes its exhaustive analysis a few bits or so behind.

A closer consideration using more modern speak and at the same time realizing that quantum physics is cloud-bound (The Standard Model of particle physics is wrong on multiple counts) mandates that we loose the grandioseness to get down to "the brass tacks".

That would be The Photon in the context of The Thermodynamic Equation of Seawater (TEOS-10).

After all, it was Albert Einstein who indicated that the TEOS-10 version is Josiah Gibbs inspired, of which Albert Einstein was quite respectful:

"Listening to Gibbs, who is perhaps the most influential historical voice in ocean thermodynamics (encapsulated in TEOS-10) would also help:

"Albert Einstein called him 'the greatest mind in American history.' Gibbs’s studies of thermodynamics and discoveries in statistical mechanics paved the way for many of Einstein’s later discoveries."

(... APSloane). Especially since "encapsulated" means:

"TEOS-10 is based on a Gibbs function formulation from which all thermodynamic properties of seawater (density, enthalpy, entropy sound speed, etc.) can be derived in a thermodynamically consistent manner."

(Thermodynamic Equation Of Seawater - 2010, emphasis added)."

(In Search Of Ocean Heat - 5). So, the next posts in this series will use the TEOS-10 C++ library to search for clues as to the conditions that would cause "ocean heat saturation" and/or the like in the worlds oceans.

Stay tuned.

The next post in this series is here, the previous post in this series is here.


Wednesday, January 15, 2025

The US States of Sea Level Change - 9

https://toolkit.climate.gov/sites/default/files/styles/large/public/FEMA_-_43003_-_Beach_erosion_from_a_storm_in_New_York.jpg?itok=bGNOpXsP
Fig. 1 East Coast

This post presents a closer look at thermal expansion and contraction caused sea level change as compared to ice sheet melt caused sea level change.

In previous posts the thermal expansion and contraction was a straight line at point zero because the actual sea level change is so much larger (Appendix: State SLC).

Today's graphs contain an additional separate graph for displaying the thermal expansion.

House on top of a crumbling cliff above ocean waves
Fig. 2 West Coast
This makes it abundantly clear how insignificant thermal expansion and contraction is when compared to the melting of Antarctica, Greenland, Glacier Bay Alaska, and to a lesser extent Patagonia.

Additionally, an HTML table is provided for each thermal expansion and contraction graph so that if needed the HTML table figures can be compared to the graph.

The economic impact of sea level change comes at a time when natural disasters are destroying more and more structures (Beach erosion will make Southern California coastal living five times more expensive by 2050).

Add to that the fact that cities can burn, and the old saying about homes has new meaning:

"That the house of every one is to him as his Castle and Fortress as well for defence against injury and violence, as for his repose; and although the life of man is precious and favoured in law; so that although a man kill another in his defence, or kill one per infortuntun’ (by misfortune), without any intent, yet it is felony, and in such case he shall forfeit his goods and chattels, for the great regard which the law hath of a mans life; But if theeves come to a mans house to rob him, or murder, and the owner or his servants kill any of the theeves in defence of himself and his house, it is no felony, and he shall lose nothing, and therewith agreeth 3 Edw. 3. Coron. 303, & 305. & 26 Ass. pl. 23. So it is holden in 21 Hen. 7. 39. every one may assemble his friends or neighbours to defend his house against violence: But he cannot assemble them to goe with him to the Market or elsewhere to keep him from violence: And the reason of all the same is, because domus sua cuique est tutissimum refugium. [everyone’s house is his safest refuge (“Every man’s home is his castle.”)]

(Online Library). "One thing is for sure on the subject of global warming induced climate change: if there was ever a time to err on the safe side, it was long ago." (Dredd Links Page).

Check out the graph appendices (GRAPHS NC OR RI SC TX VA WA, GRAPHS MD MA NJ NY, GRAPHS AK CA FL GA HI).

Also check out the HTML appendices (HTM NC OR RI SC TX VA WA, HTM MD MA NJ NY, HTM AK CA FL GA HI) [UPDATE: the HTML files have been updated. "span" in them means "lowest value to highest value", "epi, meso, and bathy" mean "epipelagic, mesopelagic, and bathypelagic" depth levels; and finally "TsSlc" means all three pelagic depths summed into one value, i.e. epi+meso+bathy].

The relevant state data in those appendices can be selected by noting that they are abbreviated (e.g. AK = Alaska, HI = Hawaii).

The previous post in this series is here.


"Come gather 'round people
Wherever you roam
And admit that the waters
Around you have grown
And accept it that soon
You'll be drenched to the bone
If your time to you is worth savin'
And you better start swimmin'
Or you'll sink like a stone
For the times they are a-changin'"


GRAPHS NC OR RI SC TX VA WA

This is an appendix to: The US States of Sea Level Change - 9


HTM MD MA NJ NY

This is an appendix to: The US States of Sea Level Change - 9


Maryland:
TsSlc span is ~(-1.74 to 2.14) ~(3.87 mm)
year TsSlc epi meso bathy
1950 0.000581 0.000248 0.000183 0.000150
1951 -1.454096 -0.329610 -1.040480 -0.084006
1952 0.380332 -0.155848 0.302037 0.234143
1953 1.805694 0.851067 0.979846 -0.025219
1954 -0.325639 0.029312 -0.244019 -0.110932
1955 0.287762 -0.375274 0.815238 -0.152202
1956 -1.737647 -0.414280 -1.401750 0.078383
1957 1.310109 0.189693 1.390720 -0.270304
1958 -0.584589 -0.078933 -0.395305 -0.110351
1959 0.011882 0.033836 -0.060781 0.038826
1960 0.566311 0.094865 0.467555 0.003891
1961 -0.309670 -0.076948 -0.412897 0.180175
1962 0.891674 0.344168 0.523021 0.024485
1963 0.064808 -0.103582 0.110122 0.058268
1964 -0.744215 -0.217103 -0.539989 0.012877
1965 0.731852 0.705414 0.511621 -0.485183
1966 0.809152 -0.119715 0.445662 0.483205
1967 -1.096200 -0.465745 -0.612672 -0.017784
1968 1.464277 0.585715 0.754415 0.124147
1969 -0.544141 -0.005369 -0.441338 -0.097434
1970 0.843150 0.112832 0.321575 0.408743
1971 -0.854528 -0.007301 -0.293628 -0.553599
1972 0.627488 0.042698 0.373534 0.211256
1973 -0.515477 -0.127906 -0.277568 -0.110003
1974 -0.618820 -0.104092 -0.422179 -0.092549
1975 0.150446 -0.275504 0.287960 0.137990
1976 -0.960362 -0.111506 -0.689854 -0.159002
1977 0.517897 -0.009494 0.396765 0.130626
1978 1.101049 0.143909 0.840889 0.116251
1979 -1.508255 -0.285743 -1.011830 -0.210682
1980 0.894506 0.488388 -0.003463 0.409581
1981 -0.567027 -0.222917 0.130354 -0.474464
1982 -0.423330 -0.062726 -0.241427 -0.119177
1983 -0.671791 -0.051970 -0.426155 -0.193666
1984 1.243038 -0.094531 0.956307 0.381262
1985 -0.552872 0.089018 -0.630510 -0.011380
1986 2.135604 0.273074 1.622830 0.239700
1987 0.967314 -0.263916 1.111380 0.119850
1988 -1.048975 0.286485 -1.335460 0.000000
1989 -1.722178 -0.325627 -0.843087 -0.553464
1990 -0.237097 0.359875 0.032413 -0.629385
1991 0.530908 -0.041040 0.537383 0.034565
1992 -0.549765 -0.327486 -0.470596 0.248317
1993 -0.121815 0.253311 -0.000040 -0.375086
1994 0.045868 -0.265781 -0.219072 0.530721
1995 0.396977 0.241896 0.656914 -0.501833
1996 0.090796 -0.244347 0.192491 0.142652
1997 0.254759 0.711873 -0.655515 0.198401
1998 1.256976 0.040029 0.933606 0.283341
1999 -0.137616 0.036224 0.250447 -0.424287
2000 1.017924 0.162632 0.560738 0.294554
2001 -0.830542 -0.424396 -0.771323 0.365177
2002 1.543716 0.498634 1.161100 -0.116018
2003 -0.677111 -0.234053 -0.160212 -0.282846
2004 0.904925 -0.052525 0.186169 0.771281
2005 -1.614426 0.029944 -0.534340 -1.110030
2006 -0.116469 -0.150576 -0.626756 0.660863
2007 0.515543 0.336170 0.959838 -0.780465
2008 1.416303 -0.160377 0.314630 1.262050
2009 -0.785418 -0.094915 -0.455099 -0.235404
2010 -0.220867 -0.147769 -0.068098 -0.005001
2011 -0.439294 0.135040 -0.326440 -0.247894
2012 0.262092 0.160751 0.404213 -0.302872
2013 0.675060 -0.063203 0.015149 0.723114
2014 -1.287206 -0.046480 -0.700554 -0.540172
2015 0.470891 0.080604 0.145471 0.244816
2016 0.448308 -0.011078 0.208663 0.250723
2017 -0.226166 0.001949 -0.016040 -0.212075
2018 -0.273198 -0.141092 -0.124801 -0.007305
2019 -0.047710 0.242758 0.067616 -0.358084
2020 0.535209 -0.088011 0.121238 0.501982
2021 0.424765 0.145707 0.331203 -0.052145
2022 -0.082306 -0.038315 -0.020808 -0.023183
2023 0.052532 -0.361824 0.352916 0.061440


Massachusetts:
TsSlc span is ~(-1.39 to 2.29) ~(3.68 mm)
year TsSlc epi meso bathy
1950 0.216628 0.000112 0.216516 0.000000
1951 0.832911 0.832911 0.000000 0.000000
1952 -0.826706 -0.418921 -0.407785 0.000000
1953 -0.840220 -0.164809 -0.675411 0.000000
1954 -0.330321 0.176237 -0.506558 0.000000
1955 0.027442 0.365147 -0.337705 0.000000
1956 -0.374259 -0.205406 -0.168853 0.000000
1957 0.006937 0.006937 0.000000 0.000000
1958 0.076915 0.052268 0.024647 0.000000
1959 -0.212066 -0.091206 -0.120860 0.000000
1960 0.136183 0.067963 0.068220 0.000000
1961 -0.367077 -0.172096 -0.194981 0.000000
1962 -0.137727 -0.040237 -0.097491 0.000000
1963 -0.031038 -0.031038 0.000000 0.000000
1964 1.628520 0.020670 1.607850 0.000000
1965 0.222080 0.081552 0.140528 0.000000
1966 -0.268617 0.131409 -0.400026 0.000000
1967 0.104622 -0.208803 0.313425 0.000000
1968 -0.465759 0.014734 -0.480493 0.000000
1969 0.258736 0.498982 -0.240246 0.000000
1970 0.031433 0.031433 0.000000 0.000000
1971 -0.116742 -0.058041 -0.058702 0.000000
1972 0.291059 -0.123370 0.414429 0.000000
1973 -0.401996 -0.173622 -0.228374 0.000000
1974 -0.145415 0.030159 -0.175574 0.000000
1975 0.579070 0.490172 0.088898 0.000000
1976 -0.465395 -0.196464 -0.268931 0.000000
1977 0.776390 0.292292 0.484098 0.000000
1978 0.062145 -0.179904 0.242049 0.000000
1979 0.195692 0.195692 0.000000 0.000000
1980 -0.050305 -0.016302 -0.034003 0.000000
1981 0.412587 -0.016168 0.428755 0.000000
1982 -0.939849 -0.135645 -0.804204 0.000000
1983 0.614979 0.314013 0.300966 0.000000
1984 0.151848 -0.111497 0.263345 0.000000
1985 0.155200 -0.070524 0.225724 0.000000
1986 0.329585 0.141481 0.188104 0.000000
1987 -0.034171 -0.184654 0.150483 0.000000
1988 -0.012529 -0.125391 0.112862 0.000000
1989 0.352237 0.276995 0.075242 0.000000
1990 -0.206236 -0.206236 0.000000 0.000000
1991 2.508107 0.069707 2.438400 0.000000
1992 -0.855261 -0.018650 -0.836611 0.000000
1993 -0.197480 0.220826 -0.418306 0.000000
1994 0.111757 0.111757 0.000000 0.000000
1995 -0.106148 -0.106148 0.000000 0.000000
1996 -0.037764 -0.037764 0.000000 0.000000
1997 0.068001 0.068001 0.000000 0.000000
1998 -0.064942 -0.064942 0.000000 0.000000
1999 0.187938 0.187938 0.000000 0.000000
2000 -0.013644 -0.013644 0.000000 0.000000
2001 -0.977427 -0.171168 -0.806259 0.000000
2002 1.292277 0.142887 1.149390 0.000000
2003 0.122207 0.080609 0.041598 0.000000
2004 -0.947864 -0.041779 -0.906086 0.000000
2005 2.260984 -0.058406 2.319390 0.000000
2006 1.255025 0.095335 1.159690 0.000000
2007 -0.089550 -0.089550 0.000000 0.000000
2008 -0.731023 -0.173334 -0.557689 0.000000
2009 0.209255 0.488100 -0.278845 0.000000
2010 -0.158159 -0.158159 0.000000 0.000000
2011 -1.170840 -0.134500 -1.036340 0.000000
2012 2.176501 0.252461 1.924040 0.000000
2013 -0.883962 0.074010 -0.957972 0.000000
2014 2.139126 0.061426 2.077700 0.000000
2015 -0.413480 -0.045150 -0.368330 0.000000
2016 0.309729 0.107586 0.202143 0.000000
2017 -0.141854 -0.118314 -0.023540 0.000000
2018 -0.667054 -0.018433 -0.648621 0.000000
2019 0.979623 0.213046 0.766577 0.000000
2020 -0.792287 -0.232729 -0.559558 0.000000
2021 0.664275 0.264396 0.399879 0.000000
2022 0.131135 -0.223809 0.354944 0.000000
2023 0.176709 -0.178235 0.354944 0.000000


New Jersey:
TsSlc span is ~(-1.56 to 1.94) ~(3.49 mm)
year TsSlc epi meso bathy
1950 0.000517 0.000184 0.000183 0.000150
1951 -0.670205 0.257531 -0.848740 -0.078996
1952 0.025688 -0.325599 0.131108 0.220179
1953 0.709094 0.122957 0.609852 -0.023715
1954 0.118036 0.228065 -0.005713 -0.104316
1955 0.621704 -0.001790 0.766619 -0.143125
1956 -1.555149 -0.310707 -1.318150 0.073708
1957 0.976462 0.082346 1.148300 -0.254184
1958 -0.400655 -0.003147 -0.293738 -0.103770
1959 -0.053383 -0.042658 -0.047236 0.036511
1960 0.421779 0.081195 0.336925 0.003659
1961 -0.333264 -0.150522 -0.352172 0.169430
1962 0.702863 0.088607 0.591232 0.023025
1963 -0.181703 -0.061791 -0.174705 0.054793
1964 -0.315009 -0.062692 -0.264426 0.012109
1965 0.255003 0.315636 0.395615 -0.456248
1966 0.721815 0.046351 0.221076 0.454388
1967 -0.715198 -0.341869 -0.356606 -0.016723
1968 0.438698 0.204134 0.117821 0.116743
1969 0.406942 0.324795 0.173770 -0.091623
1970 0.438331 0.065306 -0.011342 0.384367
1971 -0.777753 -0.042291 -0.214878 -0.520584
1972 0.641021 -0.077562 0.519926 0.198657
1973 -0.728837 -0.247073 -0.378322 -0.103442
1974 -0.390132 -0.002631 -0.300472 -0.087029
1975 0.450034 0.191110 0.129163 0.129761
1976 -0.819678 -0.183357 -0.486802 -0.149519
1977 0.675169 0.170806 0.381527 0.122836
1978 0.925229 -0.051361 0.867272 0.109318
1979 -1.125450 -0.031927 -0.895406 -0.198117
1980 0.561489 0.185411 -0.009077 0.385155
1981 -0.421434 -0.101594 0.126329 -0.446169
1982 -0.533105 -0.116813 -0.304223 -0.112069
1983 -0.274988 0.155570 -0.248442 -0.182116
1984 0.981363 -0.098829 0.721668 0.358524
1985 -0.606693 -0.003084 -0.592908 -0.010701
1986 1.937706 0.186262 1.526040 0.225404
1987 0.944159 -0.213643 1.045100 0.112702
1988 -1.279216 -0.023397 -1.255820 0.000000
1989 -1.259644 0.053620 -0.792807 -0.520457
1990 -0.761482 -0.078473 -0.091159 -0.591850
1991 0.775227 0.039341 0.703382 0.032504
1992 -0.477871 -0.135272 -0.576107 0.233508
1993 0.036000 0.261763 0.126954 -0.352717
1994 0.317798 -0.070932 -0.110340 0.499070
1995 0.057442 0.029147 0.500199 -0.471904
1996 0.189575 -0.125581 0.181012 0.134144
1997 -0.107983 0.321869 -0.616421 0.186569
1998 1.112423 -0.031948 0.877928 0.266443
1999 -0.026851 0.136622 0.235511 -0.398984
2000 0.780275 0.054232 0.449055 0.276988
2001 -0.707842 -0.281653 -0.769587 0.343398
2002 1.294814 0.289333 1.114580 -0.109099
2003 -0.435328 -0.041647 -0.127703 -0.265978
2004 0.101056 -0.048010 -0.104278 0.253344
2005 -0.761295 -0.027974 -0.176622 -0.556699
2006 0.059526 -0.001558 -0.560367 0.621451
2007 0.083580 0.065928 0.751572 -0.733920
2008 1.079464 -0.200513 0.093197 1.186780
2009 -0.083336 0.255043 -0.117014 -0.221365
2010 -0.463200 -0.160977 -0.043751 -0.258472
2011 -0.504790 -0.051397 -0.473404 0.020011
2012 0.498632 0.228524 0.554918 -0.284810
2013 0.473037 0.020106 -0.227058 0.679989
2014 -0.842260 0.017030 -0.351333 -0.507957
2015 0.266714 0.005464 0.031034 0.230216
2016 0.500159 0.059210 0.205178 0.235771
2017 -0.284714 -0.072853 -0.012433 -0.199428
2018 -0.516268 -0.069811 -0.439587 -0.006869
2019 0.324555 0.230095 0.431189 -0.336729
2020 0.074294 -0.185807 -0.211944 0.472045
2021 0.604775 0.220194 0.433616 -0.049035
2022 -0.073920 -0.162197 0.110078 -0.021801
2023 0.272516 -0.210030 0.424771 0.057776


New York:
TsSlc span is ~(-1.39 to 2.29) ~(3.68 mm)
year TsSlc epi meso bathy
1950 0.216628 0.000112 0.216516 0.000000
1951 0.832911 0.832911 0.000000 0.000000
1952 -0.826706 -0.418921 -0.407785 0.000000
1953 -0.840220 -0.164809 -0.675411 0.000000
1954 -0.330321 0.176237 -0.506558 0.000000
1955 0.027442 0.365147 -0.337705 0.000000
1956 -0.374259 -0.205406 -0.168853 0.000000
1957 0.006937 0.006937 0.000000 0.000000
1958 0.076915 0.052268 0.024647 0.000000
1959 -0.212066 -0.091206 -0.120860 0.000000
1960 0.136183 0.067963 0.068220 0.000000
1961 -0.367077 -0.172096 -0.194981 0.000000
1962 -0.137727 -0.040237 -0.097491 0.000000
1963 -0.031038 -0.031038 0.000000 0.000000
1964 1.628520 0.020670 1.607850 0.000000
1965 0.222080 0.081552 0.140528 0.000000
1966 -0.268617 0.131409 -0.400026 0.000000
1967 0.104622 -0.208803 0.313425 0.000000
1968 -0.465759 0.014734 -0.480493 0.000000
1969 0.258736 0.498982 -0.240246 0.000000
1970 0.031433 0.031433 0.000000 0.000000
1971 -0.116742 -0.058041 -0.058702 0.000000
1972 0.291059 -0.123370 0.414429 0.000000
1973 -0.401996 -0.173622 -0.228374 0.000000
1974 -0.145415 0.030159 -0.175574 0.000000
1975 0.579070 0.490172 0.088898 0.000000
1976 -0.465395 -0.196464 -0.268931 0.000000
1977 0.776390 0.292292 0.484098 0.000000
1978 0.062145 -0.179904 0.242049 0.000000
1979 0.195692 0.195692 0.000000 0.000000
1980 -0.050305 -0.016302 -0.034003 0.000000
1981 0.412587 -0.016168 0.428755 0.000000
1982 -0.939849 -0.135645 -0.804204 0.000000
1983 0.614979 0.314013 0.300966 0.000000
1984 0.151848 -0.111497 0.263345 0.000000
1985 0.155200 -0.070524 0.225724 0.000000
1986 0.329585 0.141481 0.188104 0.000000
1987 -0.034171 -0.184654 0.150483 0.000000
1988 -0.012529 -0.125391 0.112862 0.000000
1989 0.352237 0.276995 0.075242 0.000000
1990 -0.206236 -0.206236 0.000000 0.000000
1991 2.508107 0.069707 2.438400 0.000000
1992 -0.855261 -0.018650 -0.836611 0.000000
1993 -0.197480 0.220826 -0.418306 0.000000
1994 0.111757 0.111757 0.000000 0.000000
1995 -0.106148 -0.106148 0.000000 0.000000
1996 -0.037764 -0.037764 0.000000 0.000000
1997 0.068001 0.068001 0.000000 0.000000
1998 -0.064942 -0.064942 0.000000 0.000000
1999 0.187938 0.187938 0.000000 0.000000
2000 -0.013644 -0.013644 0.000000 0.000000
2001 -0.977427 -0.171168 -0.806259 0.000000
2002 1.292277 0.142887 1.149390 0.000000
2003 0.122207 0.080609 0.041598 0.000000
2004 -0.947864 -0.041779 -0.906086 0.000000
2005 2.260984 -0.058406 2.319390 0.000000
2006 1.255025 0.095335 1.159690 0.000000
2007 -0.089550 -0.089550 0.000000 0.000000
2008 -0.731023 -0.173334 -0.557689 0.000000
2009 0.209255 0.488100 -0.278845 0.000000
2010 -0.158159 -0.158159 0.000000 0.000000
2011 -1.170840 -0.134500 -1.036340 0.000000
2012 2.176501 0.252461 1.924040 0.000000
2013 -0.883962 0.074010 -0.957972 0.000000
2014 2.139126 0.061426 2.077700 0.000000
2015 -0.413480 -0.045150 -0.368330 0.000000
2016 0.309729 0.107586 0.202143 0.000000
2017 -0.141854 -0.118314 -0.023540 0.000000
2018 -0.667054 -0.018433 -0.648621 0.000000
2019 0.979623 0.213046 0.766577 0.000000
2020 -0.792287 -0.232729 -0.559558 0.000000
2021 0.664275 0.264396 0.399879 0.000000
2022 0.131135 -0.223809 0.354944 0.000000
2023 0.176709 -0.178235 0.354944 0.000000

HTM NC OR RI SC TX VA WA

This is an appendix to: The US States of Sea Level Change - 9


North Carolina:
TsSlc span is ~(-1.74 to 2.14) ~(3.87 mm)
year TsSlc epi meso bathy
1950 0.000581 0.000248 0.000183 0.000150
1951 -1.454096 -0.329610 -1.040480 -0.084006
1952 0.380332 -0.155848 0.302037 0.234143
1953 1.805694 0.851067 0.979846 -0.025219
1954 -0.325639 0.029312 -0.244019 -0.110932
1955 0.287762 -0.375274 0.815238 -0.152202
1956 -1.737647 -0.414280 -1.401750 0.078383
1957 1.310109 0.189693 1.390720 -0.270304
1958 -0.584589 -0.078933 -0.395305 -0.110351
1959 0.011882 0.033836 -0.060781 0.038826
1960 0.566311 0.094865 0.467555 0.003891
1961 -0.309670 -0.076948 -0.412897 0.180175
1962 0.891674 0.344168 0.523021 0.024485
1963 0.064808 -0.103582 0.110122 0.058268
1964 -0.744215 -0.217103 -0.539989 0.012877
1965 0.731852 0.705414 0.511621 -0.485183
1966 0.809152 -0.119715 0.445662 0.483205
1967 -1.096200 -0.465745 -0.612672 -0.017784
1968 1.464277 0.585715 0.754415 0.124147
1969 -0.544141 -0.005369 -0.441338 -0.097434
1970 0.843150 0.112832 0.321575 0.408743
1971 -0.854528 -0.007301 -0.293628 -0.553599
1972 0.627488 0.042698 0.373534 0.211256
1973 -0.515477 -0.127906 -0.277568 -0.110003
1974 -0.618820 -0.104092 -0.422179 -0.092549
1975 0.150446 -0.275504 0.287960 0.137990
1976 -0.960362 -0.111506 -0.689854 -0.159002
1977 0.517897 -0.009494 0.396765 0.130626
1978 1.101049 0.143909 0.840889 0.116251
1979 -1.508255 -0.285743 -1.011830 -0.210682
1980 0.894506 0.488388 -0.003463 0.409581
1981 -0.567027 -0.222917 0.130354 -0.474464
1982 -0.423330 -0.062726 -0.241427 -0.119177
1983 -0.671791 -0.051970 -0.426155 -0.193666
1984 1.243038 -0.094531 0.956307 0.381262
1985 -0.552872 0.089018 -0.630510 -0.011380
1986 2.135604 0.273074 1.622830 0.239700
1987 0.967314 -0.263916 1.111380 0.119850
1988 -1.048975 0.286485 -1.335460 0.000000
1989 -1.722178 -0.325627 -0.843087 -0.553464
1990 -0.237097 0.359875 0.032413 -0.629385
1991 0.530908 -0.041040 0.537383 0.034565
1992 -0.549765 -0.327486 -0.470596 0.248317
1993 -0.121815 0.253311 -0.000040 -0.375086
1994 0.045868 -0.265781 -0.219072 0.530721
1995 0.396977 0.241896 0.656914 -0.501833
1996 0.090796 -0.244347 0.192491 0.142652
1997 0.254759 0.711873 -0.655515 0.198401
1998 1.256976 0.040029 0.933606 0.283341
1999 -0.137616 0.036224 0.250447 -0.424287
2000 1.017924 0.162632 0.560738 0.294554
2001 -0.830542 -0.424396 -0.771323 0.365177
2002 1.543716 0.498634 1.161100 -0.116018
2003 -0.677111 -0.234053 -0.160212 -0.282846
2004 0.904925 -0.052525 0.186169 0.771281
2005 -1.614426 0.029944 -0.534340 -1.110030
2006 -0.116469 -0.150576 -0.626756 0.660863
2007 0.515543 0.336170 0.959838 -0.780465
2008 1.416303 -0.160377 0.314630 1.262050
2009 -0.785418 -0.094915 -0.455099 -0.235404
2010 -0.220867 -0.147769 -0.068098 -0.005001
2011 -0.439294 0.135040 -0.326440 -0.247894
2012 0.262092 0.160751 0.404213 -0.302872
2013 0.675060 -0.063203 0.015149 0.723114
2014 -1.287206 -0.046480 -0.700554 -0.540172
2015 0.470891 0.080604 0.145471 0.244816
2016 0.448308 -0.011078 0.208663 0.250723
2017 -0.226166 0.001949 -0.016040 -0.212075
2018 -0.273198 -0.141092 -0.124801 -0.007305
2019 -0.047710 0.242758 0.067616 -0.358084
2020 0.535209 -0.088011 0.121238 0.501982
2021 0.424765 0.145707 0.331203 -0.052145
2022 -0.082306 -0.038315 -0.020808 -0.023183
2023 0.052532 -0.361824 0.352916 0.061440


Oregon:
TsSlc span is ~(-1.90 to 2.21) ~(4.11 mm)
year TsSlc epi meso bathy
1950 0.000384 0.000140 0.000124 0.000120
1951 -0.633685 0.003768 0.032350 -0.669802
1952 0.150769 0.032240 -0.025828 0.144357
1953 -0.001722 0.016375 -0.004395 -0.013702
1954 0.058950 0.008524 -0.040774 0.091199
1955 -0.204581 -0.045025 0.001449 -0.161006
1956 -0.087872 -0.020858 0.006043 -0.073058
1957 0.096629 0.024388 0.010876 0.061365
1958 0.066228 0.027536 0.027636 0.011056
1959 0.059768 0.002037 -0.014751 0.072482
1960 -0.322388 -0.016746 0.000416 -0.306058
1961 0.212588 0.021129 -0.014716 0.206175
1962 -0.140917 -0.006172 0.019343 -0.154088
1963 0.113475 0.029115 0.004190 0.080170
1964 -0.090848 -0.049709 -0.023289 -0.017849
1965 0.122497 -0.001919 0.030815 0.093601
1966 0.013234 0.008539 -0.005870 0.010565
1967 0.056973 0.052742 0.003667 0.000564
1968 -0.375082 -0.057488 -0.041996 -0.275597
1969 0.208773 0.021337 0.020314 0.167122
1970 0.046395 -0.007658 0.065395 -0.011342
1971 0.044063 -0.027486 -0.036339 0.107888
1972 0.018568 -0.007432 0.001376 0.024624
1973 0.067007 0.003173 -0.007547 0.071381
1974 -0.030469 0.020535 0.046360 -0.097364
1975 0.263520 -0.003703 -0.026091 0.293314
1976 -0.037582 0.011660 0.005913 -0.055156
1977 -0.098097 0.017694 0.106722 -0.222513
1978 0.094140 -0.003010 -0.093194 0.190344
1979 0.139667 -0.021908 0.034612 0.126963
1980 -0.147955 0.029194 -0.064334 -0.112814
1981 -0.311544 0.030579 0.007443 -0.349566
1982 0.193717 -0.053255 -0.030118 0.277090
1983 -0.042586 0.071865 0.025792 -0.140244
1984 0.111364 -0.043631 -0.015823 0.170817
1985 -0.344816 -0.015992 -0.010140 -0.318684
1986 0.163711 0.010271 0.056834 0.096606
1987 0.144548 0.019968 0.084652 0.039928
1988 -0.106188 -0.021917 0.000528 -0.084799
1989 0.209140 -0.015803 0.062786 0.162157
1990 -0.336471 0.006432 -0.154316 -0.188587
1991 0.047755 -0.035830 -0.059955 0.143540
1992 0.074925 0.142769 0.030152 -0.097995
1993 -0.203273 -0.083893 -0.040802 -0.078577
1994 0.563805 0.017882 0.130471 0.415452
1995 -0.477026 -0.016880 -0.146430 -0.313716
1996 -0.054633 0.000288 0.036982 -0.091903
1997 0.163223 0.015216 0.028323 0.119684
1998 0.009781 0.037313 -0.011275 -0.016257
1999 -0.099348 -0.066572 -0.016266 -0.016510
2000 0.077780 0.021154 0.015341 0.041285
2001 -0.038143 0.002958 -0.016282 -0.024818
2002 0.003355 -0.027732 0.029067 0.002021
2003 -0.265114 0.013510 -0.026648 -0.251976
2004 0.321839 0.043966 0.026780 0.251093
2005 2.211967 -0.008476 0.107903 2.112540
2006 -1.894713 -0.021028 -0.092545 -1.781140
2007 -0.096794 0.005123 -0.024127 -0.077790
2008 0.130132 -0.034228 -0.021923 0.186283
2009 0.001789 0.006021 0.017163 -0.021395
2010 0.311752 0.022589 -0.005529 0.294692
2011 -0.337759 -0.035982 -0.010178 -0.291598
2012 0.153726 0.013375 0.029697 0.110655
2013 -0.175835 0.021048 -0.015844 -0.181039
2014 0.038519 0.035355 0.006040 -0.002876
2015 0.112301 0.044420 -0.012221 0.080102
2016 0.013280 -0.027410 -0.009639 0.050328
2017 -0.051859 -0.021104 0.008008 -0.038763
2018 0.088190 0.011323 0.015378 0.061489
2019 0.048173 -0.003030 0.004980 0.046224
2020 -0.112430 -0.018714 -0.012707 -0.081009
2021 0.103085 -0.016968 0.004412 0.115641
2022 0.004140 0.024760 -0.010784 -0.009836
2023 -0.018906 0.065585 0.019473 -0.103965


Rhode Island:
TsSlc span is ~(-1.39 to 2.29) ~(3.68 mm)
year TsSlc epi meso bathy
1950 0.216628 0.000112 0.216516 0.000000
1951 0.832911 0.832911 0.000000 0.000000
1952 -0.826706 -0.418921 -0.407785 0.000000
1953 -0.840220 -0.164809 -0.675411 0.000000
1954 -0.330321 0.176237 -0.506558 0.000000
1955 0.027442 0.365147 -0.337705 0.000000
1956 -0.374259 -0.205406 -0.168853 0.000000
1957 0.006937 0.006937 0.000000 0.000000
1958 0.076915 0.052268 0.024647 0.000000
1959 -0.212066 -0.091206 -0.120860 0.000000
1960 0.136183 0.067963 0.068220 0.000000
1961 -0.367077 -0.172096 -0.194981 0.000000
1962 -0.137727 -0.040237 -0.097491 0.000000
1963 -0.031038 -0.031038 0.000000 0.000000
1964 1.628520 0.020670 1.607850 0.000000
1965 0.222080 0.081552 0.140528 0.000000
1966 -0.268617 0.131409 -0.400026 0.000000
1967 0.104622 -0.208803 0.313425 0.000000
1968 -0.465759 0.014734 -0.480493 0.000000
1969 0.258736 0.498982 -0.240246 0.000000
1970 0.031433 0.031433 0.000000 0.000000
1971 -0.116742 -0.058041 -0.058702 0.000000
1972 0.291059 -0.123370 0.414429 0.000000
1973 -0.401996 -0.173622 -0.228374 0.000000
1974 -0.145415 0.030159 -0.175574 0.000000
1975 0.579070 0.490172 0.088898 0.000000
1976 -0.465395 -0.196464 -0.268931 0.000000
1977 0.776390 0.292292 0.484098 0.000000
1978 0.062145 -0.179904 0.242049 0.000000
1979 0.195692 0.195692 0.000000 0.000000
1980 -0.050305 -0.016302 -0.034003 0.000000
1981 0.412587 -0.016168 0.428755 0.000000
1982 -0.939849 -0.135645 -0.804204 0.000000
1983 0.614979 0.314013 0.300966 0.000000
1984 0.151848 -0.111497 0.263345 0.000000
1985 0.155200 -0.070524 0.225724 0.000000
1986 0.329585 0.141481 0.188104 0.000000
1987 -0.034171 -0.184654 0.150483 0.000000
1988 -0.012529 -0.125391 0.112862 0.000000
1989 0.352237 0.276995 0.075242 0.000000
1990 -0.206236 -0.206236 0.000000 0.000000
1991 2.508107 0.069707 2.438400 0.000000
1992 -0.855261 -0.018650 -0.836611 0.000000
1993 -0.197480 0.220826 -0.418306 0.000000
1994 0.111757 0.111757 0.000000 0.000000
1995 -0.106148 -0.106148 0.000000 0.000000
1996 -0.037764 -0.037764 0.000000 0.000000
1997 0.068001 0.068001 0.000000 0.000000
1998 -0.064942 -0.064942 0.000000 0.000000
1999 0.187938 0.187938 0.000000 0.000000
2000 -0.013644 -0.013644 0.000000 0.000000
2001 -0.977427 -0.171168 -0.806259 0.000000
2002 1.292277 0.142887 1.149390 0.000000
2003 0.122207 0.080609 0.041598 0.000000
2004 -0.947864 -0.041779 -0.906086 0.000000
2005 2.260984 -0.058406 2.319390 0.000000
2006 1.255025 0.095335 1.159690 0.000000
2007 -0.089550 -0.089550 0.000000 0.000000
2008 -0.731023 -0.173334 -0.557689 0.000000
2009 0.209255 0.488100 -0.278845 0.000000
2010 -0.158159 -0.158159 0.000000 0.000000
2011 -1.170840 -0.134500 -1.036340 0.000000
2012 2.176501 0.252461 1.924040 0.000000
2013 -0.883962 0.074010 -0.957972 0.000000
2014 2.139126 0.061426 2.077700 0.000000
2015 -0.413480 -0.045150 -0.368330 0.000000
2016 0.309729 0.107586 0.202143 0.000000
2017 -0.141854 -0.118314 -0.023540 0.000000
2018 -0.667054 -0.018433 -0.648621 0.000000
2019 0.979623 0.213046 0.766577 0.000000
2020 -0.792287 -0.232729 -0.559558 0.000000
2021 0.664275 0.264396 0.399879 0.000000
2022 0.131135 -0.223809 0.354944 0.000000
2023 0.176709 -0.178235 0.354944 0.000000


South Carolina:
TsSlc span is ~(-1.94 to 1.98) ~(3.93 mm)
year TsSlc epi meso bathy
1950 0.000581 0.000248 0.000183 0.000150
1951 -1.319781 -0.195295 -1.040480 -0.084006
1952 0.319631 -0.216549 0.302037 0.234143
1953 1.530450 0.575823 0.979846 -0.025219
1954 -0.038794 0.316157 -0.244019 -0.110932
1955 0.170584 -0.492452 0.815238 -0.152202
1956 -1.737647 -0.414280 -1.401750 0.078383
1957 1.310109 0.189693 1.390720 -0.270304
1958 -0.531937 -0.026281 -0.395305 -0.110351
1959 0.065126 0.087080 -0.060781 0.038826
1960 0.459215 -0.012231 0.467555 0.003891
1961 -0.309670 -0.076948 -0.412897 0.180175
1962 0.891674 0.344168 0.523021 0.024485
1963 0.239899 0.071509 0.110122 0.058268
1964 -0.695964 -0.168852 -0.539989 0.012877
1965 0.420355 0.393917 0.511621 -0.485183
1966 0.907796 -0.021071 0.445662 0.483205
1967 -0.944577 -0.314122 -0.612672 -0.017784
1968 1.191958 0.313396 0.754415 0.124147
1969 -0.525614 0.016281 -0.444461 -0.097434
1970 0.784547 0.046292 0.329512 0.408743
1971 -0.163960 0.259798 0.129841 -0.553599
1972 0.294010 -0.077228 0.159982 0.211256
1973 -0.956497 -0.294701 -0.551793 -0.110003
1974 -0.149325 0.054160 -0.110936 -0.092549
1975 -0.070758 -0.235271 0.026523 0.137990
1976 -0.236412 0.030235 -0.107645 -0.159002
1977 -0.372240 -0.253689 -0.249177 0.130626
1978 1.084740 0.258896 0.709593 0.116251
1979 -1.336175 -0.212872 -0.912621 -0.210682
1980 0.726257 0.320081 -0.003405 0.409581
1981 -0.532842 -0.188732 0.130354 -0.474464
1982 -0.098970 0.120083 -0.099876 -0.119177
1983 -0.998245 -0.341752 -0.462827 -0.193666
1984 1.096838 -0.048375 0.763951 0.381262
1985 -0.362132 0.241169 -0.591921 -0.011380
1986 1.981864 0.119334 1.622830 0.239700
1987 0.967314 -0.263916 1.111380 0.119850
1988 -0.749295 0.586165 -1.335460 0.000000
1989 -1.943605 -0.547054 -0.843087 -0.553464
1990 0.135251 0.732223 0.032413 -0.629385
1991 0.373491 -0.198458 0.537383 0.034565
1992 -0.503504 -0.281225 -0.470596 0.248317
1993 -0.171159 0.203967 -0.000040 -0.375086
1994 0.074981 -0.236668 -0.219072 0.530721
1995 0.129172 -0.025909 0.656914 -0.501833
1996 0.279037 -0.056106 0.192491 0.142652
1997 0.056310 0.513424 -0.655515 0.198401
1998 1.369833 0.177480 0.909012 0.283341
1999 -0.168402 0.010656 0.245229 -0.424287
2000 1.009474 0.134527 0.580393 0.294554
2001 -0.756300 -0.350154 -0.771323 0.365177
2002 1.474178 0.429096 1.161100 -0.116018
2003 -0.647559 -0.204501 -0.160212 -0.282846
2004 0.879164 -0.078286 0.186169 0.771281
2005 -1.619325 0.025045 -0.534340 -1.110030
2006 -0.031363 -0.065470 -0.626756 0.660863
2007 0.495403 0.316030 0.959838 -0.780465
2008 1.377553 -0.199127 0.314630 1.262050
2009 -0.825382 -0.134879 -0.455099 -0.235404
2010 -0.097734 -0.024635 -0.068098 -0.005001
2011 -0.435480 0.138854 -0.326440 -0.247894
2012 -0.015708 -0.117049 0.404213 -0.302872
2013 0.878182 0.139919 0.015149 0.723114
2014 -1.181286 0.059440 -0.700554 -0.540172
2015 0.349952 -0.073469 0.178605 0.244816
2016 0.557504 0.132746 0.174035 0.250723
2017 -0.532922 -0.173259 -0.147588 -0.212075
2018 -0.198540 -0.117057 -0.074178 -0.007305
2019 -0.037676 0.212599 0.107809 -0.358084
2020 0.506535 -0.029366 0.033919 0.501982
2021 0.320403 0.080565 0.291982 -0.052145
2022 0.266832 0.143484 0.146531 -0.023183
2023 0.068385 -0.345971 0.352916 0.061440


Texas:
TsSlc span is ~(-1.91 to 1.57) ~(3.48 mm)
year TsSlc epi meso bathy
1950 0.000000 0.000000 0.000000 0.000000
1951 0.000000 0.000000 0.000000 0.000000
1952 -0.591207 -0.306185 -0.270883 -0.014139
1953 -0.097194 -0.006199 0.109566 -0.200561
1954 -0.085045 -0.005424 0.095870 -0.175491
1955 -0.072896 -0.004649 0.082175 -0.150421
1956 -0.048597 -0.003100 0.054783 -0.100281
1957 -0.024299 -0.001550 0.027391 -0.050140
1958 0.000000 0.000000 0.000000 0.000000
1959 0.276667 0.054874 0.218792 0.003001
1960 0.107433 -0.154579 0.211897 0.050115
1961 0.115144 0.335251 -0.397037 0.176930
1962 -0.450608 -0.252295 -0.053897 -0.144416
1963 0.331640 -0.022018 -0.014673 0.368331
1964 -0.399045 -0.003937 0.015030 -0.410139
1965 0.049942 0.066715 -0.099411 0.082638
1966 -0.237085 -0.169287 -0.001046 -0.066752
1967 0.422775 0.323662 0.116023 -0.016910
1968 -0.091450 -0.078264 -0.023145 0.009959
1969 0.366433 0.287284 0.085184 -0.006035
1970 -0.283015 -0.203635 -0.083554 0.004174
1971 0.148835 0.070686 -0.003954 0.082103
1972 0.181289 0.104194 0.142259 -0.065164
1973 -0.238518 -0.227073 -0.002851 -0.008594
1974 0.025190 0.033061 -0.001425 -0.006446
1975 0.080383 0.084680 0.000000 -0.004297
1976 -0.376352 -0.226498 -0.149854 0.000000
1977 0.681292 -0.074511 0.755803 0.000000
1978 0.769139 0.259950 0.509189 0.000000
1979 0.626857 -0.175231 0.802088 0.000000
1980 1.571036 0.368696 1.202340 0.000000
1981 -1.911052 0.184348 -2.095400 0.000000
1982 0.063034 0.000000 0.063034 0.000000
1983 0.642295 0.636539 0.005756 0.000000
1984 -0.424181 -0.573519 0.149338 0.000000
1985 -0.471814 0.201992 -0.673806 0.000000
1986 0.292712 -0.015809 0.138048 0.170473
1987 -0.618911 -0.161695 -0.258997 -0.198219
1988 0.397510 0.153550 0.123134 0.120826
1989 -0.416121 -0.043743 -0.242400 -0.129978
1990 0.042192 0.041713 -0.001332 0.001811
1991 0.065406 -0.038061 0.082206 0.021261
1992 0.181308 -0.011292 0.043012 0.149588
1993 -0.087419 -0.049113 -0.042803 0.004497
1994 -0.253252 -0.029677 -0.044496 -0.179079
1995 0.081362 0.158644 0.079412 -0.156694
1996 -0.005217 0.089386 0.039706 -0.134309
1997 -0.379635 -0.290096 0.000000 -0.089539
1998 0.346935 0.141111 0.272978 -0.067154
1999 0.332232 0.240513 0.136489 -0.044770
2000 -0.102561 -0.102561 0.000000 0.000000
2001 -0.347080 -0.176360 -0.160786 -0.009934
2002 0.433581 0.227452 0.156887 0.049242
2003 0.095005 -0.085357 0.137276 0.043087
2004 -0.016571 -0.171167 0.117665 0.036931
2005 0.525749 0.416530 0.078443 0.030776
2006 0.091288 0.027446 0.039222 0.024621
2007 -0.287386 -0.305852 0.000000 0.018466
2008 0.343122 0.330812 0.000000 0.012311
2009 0.110252 0.104097 0.000000 0.006155
2010 -0.380380 -0.380380 0.000000 0.000000
2011 0.225866 -0.065062 0.011170 0.279759
2012 -0.074295 0.226724 0.018403 -0.319422
2013 0.095551 -0.047228 0.081756 0.061024
2014 -0.118457 -0.084971 -0.028444 -0.005041
2015 0.085343 0.088822 0.015696 -0.019175
2016 0.163809 0.046033 0.076078 0.041698
2017 -0.222081 -0.056444 -0.125459 -0.040179
2018 0.047734 -0.012908 0.030145 0.030497
2019 0.192682 0.120818 0.072370 -0.000506
2020 -0.030544 -0.009383 -0.037230 0.016068
2021 -0.153579 -0.125053 -0.010326 -0.018200
2022 0.083383 0.015563 0.073614 -0.005794
2023 0.299755 0.261896 -0.017621 0.055481


Virginia:
TsSlc span is ~(-1.74 to 2.14) ~(3.87 mm)
year TsSlc epi meso bathy
1950 0.000581 0.000248 0.000183 0.000150
1951 -1.454096 -0.329610 -1.040480 -0.084006
1952 0.380332 -0.155848 0.302037 0.234143
1953 1.805694 0.851067 0.979846 -0.025219
1954 -0.325639 0.029312 -0.244019 -0.110932
1955 0.287762 -0.375274 0.815238 -0.152202
1956 -1.737647 -0.414280 -1.401750 0.078383
1957 1.310109 0.189693 1.390720 -0.270304
1958 -0.584589 -0.078933 -0.395305 -0.110351
1959 0.011882 0.033836 -0.060781 0.038826
1960 0.566311 0.094865 0.467555 0.003891
1961 -0.309670 -0.076948 -0.412897 0.180175
1962 0.891674 0.344168 0.523021 0.024485
1963 0.064808 -0.103582 0.110122 0.058268
1964 -0.744215 -0.217103 -0.539989 0.012877
1965 0.731852 0.705414 0.511621 -0.485183
1966 0.809152 -0.119715 0.445662 0.483205
1967 -1.096200 -0.465745 -0.612672 -0.017784
1968 1.464277 0.585715 0.754415 0.124147
1969 -0.544141 -0.005369 -0.441338 -0.097434
1970 0.843150 0.112832 0.321575 0.408743
1971 -0.854528 -0.007301 -0.293628 -0.553599
1972 0.627488 0.042698 0.373534 0.211256
1973 -0.515477 -0.127906 -0.277568 -0.110003
1974 -0.618820 -0.104092 -0.422179 -0.092549
1975 0.150446 -0.275504 0.287960 0.137990
1976 -0.960362 -0.111506 -0.689854 -0.159002
1977 0.517897 -0.009494 0.396765 0.130626
1978 1.101049 0.143909 0.840889 0.116251
1979 -1.508255 -0.285743 -1.011830 -0.210682
1980 0.894506 0.488388 -0.003463 0.409581
1981 -0.567027 -0.222917 0.130354 -0.474464
1982 -0.423330 -0.062726 -0.241427 -0.119177
1983 -0.671791 -0.051970 -0.426155 -0.193666
1984 1.243038 -0.094531 0.956307 0.381262
1985 -0.552872 0.089018 -0.630510 -0.011380
1986 2.135604 0.273074 1.622830 0.239700
1987 0.967314 -0.263916 1.111380 0.119850
1988 -1.048975 0.286485 -1.335460 0.000000
1989 -1.722178 -0.325627 -0.843087 -0.553464
1990 -0.237097 0.359875 0.032413 -0.629385
1991 0.530908 -0.041040 0.537383 0.034565
1992 -0.549765 -0.327486 -0.470596 0.248317
1993 -0.121815 0.253311 -0.000040 -0.375086
1994 0.045868 -0.265781 -0.219072 0.530721
1995 0.396977 0.241896 0.656914 -0.501833
1996 0.090796 -0.244347 0.192491 0.142652
1997 0.254759 0.711873 -0.655515 0.198401
1998 1.256976 0.040029 0.933606 0.283341
1999 -0.137616 0.036224 0.250447 -0.424287
2000 1.017924 0.162632 0.560738 0.294554
2001 -0.830542 -0.424396 -0.771323 0.365177
2002 1.543716 0.498634 1.161100 -0.116018
2003 -0.677111 -0.234053 -0.160212 -0.282846
2004 0.904925 -0.052525 0.186169 0.771281
2005 -1.614426 0.029944 -0.534340 -1.110030
2006 -0.116469 -0.150576 -0.626756 0.660863
2007 0.515543 0.336170 0.959838 -0.780465
2008 1.416303 -0.160377 0.314630 1.262050
2009 -0.785418 -0.094915 -0.455099 -0.235404
2010 -0.220867 -0.147769 -0.068098 -0.005001
2011 -0.439294 0.135040 -0.326440 -0.247894
2012 0.262092 0.160751 0.404213 -0.302872
2013 0.675060 -0.063203 0.015149 0.723114
2014 -1.287206 -0.046480 -0.700554 -0.540172
2015 0.470891 0.080604 0.145471 0.244816
2016 0.448308 -0.011078 0.208663 0.250723
2017 -0.226166 0.001949 -0.016040 -0.212075
2018 -0.273198 -0.141092 -0.124801 -0.007305
2019 -0.047710 0.242758 0.067616 -0.358084
2020 0.535209 -0.088011 0.121238 0.501982
2021 0.424765 0.145707 0.331203 -0.052145
2022 -0.082306 -0.038315 -0.020808 -0.023183
2023 0.052532 -0.361824 0.352916 0.061440


Washington:
TsSlc span is ~(-1.90 to 2.21) ~(4.11 mm)
year TsSlc epi meso bathy
1950 0.000384 0.000140 0.000124 0.000120
1951 -0.633685 0.003768 0.032350 -0.669802
1952 0.150769 0.032240 -0.025828 0.144357
1953 -0.001722 0.016375 -0.004395 -0.013702
1954 0.058950 0.008524 -0.040774 0.091199
1955 -0.204581 -0.045025 0.001449 -0.161006
1956 -0.087872 -0.020858 0.006043 -0.073058
1957 0.096629 0.024388 0.010876 0.061365
1958 0.066228 0.027536 0.027636 0.011056
1959 0.059768 0.002037 -0.014751 0.072482
1960 -0.322388 -0.016746 0.000416 -0.306058
1961 0.212588 0.021129 -0.014716 0.206175
1962 -0.140917 -0.006172 0.019343 -0.154088
1963 0.113475 0.029115 0.004190 0.080170
1964 -0.090848 -0.049709 -0.023289 -0.017849
1965 0.122497 -0.001919 0.030815 0.093601
1966 0.013234 0.008539 -0.005870 0.010565
1967 0.056973 0.052742 0.003667 0.000564
1968 -0.375082 -0.057488 -0.041996 -0.275597
1969 0.208773 0.021337 0.020314 0.167122
1970 0.046395 -0.007658 0.065395 -0.011342
1971 0.044063 -0.027486 -0.036339 0.107888
1972 0.018568 -0.007432 0.001376 0.024624
1973 0.067007 0.003173 -0.007547 0.071381
1974 -0.030469 0.020535 0.046360 -0.097364
1975 0.263520 -0.003703 -0.026091 0.293314
1976 -0.037582 0.011660 0.005913 -0.055156
1977 -0.098097 0.017694 0.106722 -0.222513
1978 0.094140 -0.003010 -0.093194 0.190344
1979 0.139667 -0.021908 0.034612 0.126963
1980 -0.147955 0.029194 -0.064334 -0.112814
1981 -0.311544 0.030579 0.007443 -0.349566
1982 0.193717 -0.053255 -0.030118 0.277090
1983 -0.042586 0.071865 0.025792 -0.140244
1984 0.111364 -0.043631 -0.015823 0.170817
1985 -0.344816 -0.015992 -0.010140 -0.318684
1986 0.163711 0.010271 0.056834 0.096606
1987 0.144548 0.019968 0.084652 0.039928
1988 -0.106188 -0.021917 0.000528 -0.084799
1989 0.209140 -0.015803 0.062786 0.162157
1990 -0.336471 0.006432 -0.154316 -0.188587
1991 0.047755 -0.035830 -0.059955 0.143540
1992 0.074925 0.142769 0.030152 -0.097995
1993 -0.203273 -0.083893 -0.040802 -0.078577
1994 0.563805 0.017882 0.130471 0.415452
1995 -0.477026 -0.016880 -0.146430 -0.313716
1996 -0.054633 0.000288 0.036982 -0.091903
1997 0.163223 0.015216 0.028323 0.119684
1998 0.009781 0.037313 -0.011275 -0.016257
1999 -0.099348 -0.066572 -0.016266 -0.016510
2000 0.077780 0.021154 0.015341 0.041285
2001 -0.038143 0.002958 -0.016282 -0.024818
2002 0.003355 -0.027732 0.029067 0.002021
2003 -0.265114 0.013510 -0.026648 -0.251976
2004 0.321839 0.043966 0.026780 0.251093
2005 2.211967 -0.008476 0.107903 2.112540
2006 -1.894713 -0.021028 -0.092545 -1.781140
2007 -0.096794 0.005123 -0.024127 -0.077790
2008 0.130132 -0.034228 -0.021923 0.186283
2009 0.001789 0.006021 0.017163 -0.021395
2010 0.311752 0.022589 -0.005529 0.294692
2011 -0.337759 -0.035982 -0.010178 -0.291598
2012 0.153726 0.013375 0.029697 0.110655
2013 -0.175835 0.021048 -0.015844 -0.181039
2014 0.038519 0.035355 0.006040 -0.002876
2015 0.112301 0.044420 -0.012221 0.080102
2016 0.013280 -0.027410 -0.009639 0.050328
2017 -0.051859 -0.021104 0.008008 -0.038763
2018 0.088190 0.011323 0.015378 0.061489
2019 0.048173 -0.003030 0.004980 0.046224
2020 -0.112430 -0.018714 -0.012707 -0.081009
2021 0.103085 -0.016968 0.004412 0.115641
2022 0.004140 0.024760 -0.010784 -0.009836
2023 -0.018906 0.065585 0.019473 -0.103965