|
| Complicated Change |
I. Review
This series deals with the sea level changes around the world at seaports (Seaports With Sea Level Change, 2, 3, 4, 5, 6, 7, 8, 9, 10).
This series is updated from time to time as the Permanent Service for Mean Sea Level (PSMSL) updates datasets.
Today's post is composed from updated data based on the PSMSL dataset dated "5 OCT 2020".
II. Seaport Data By Country
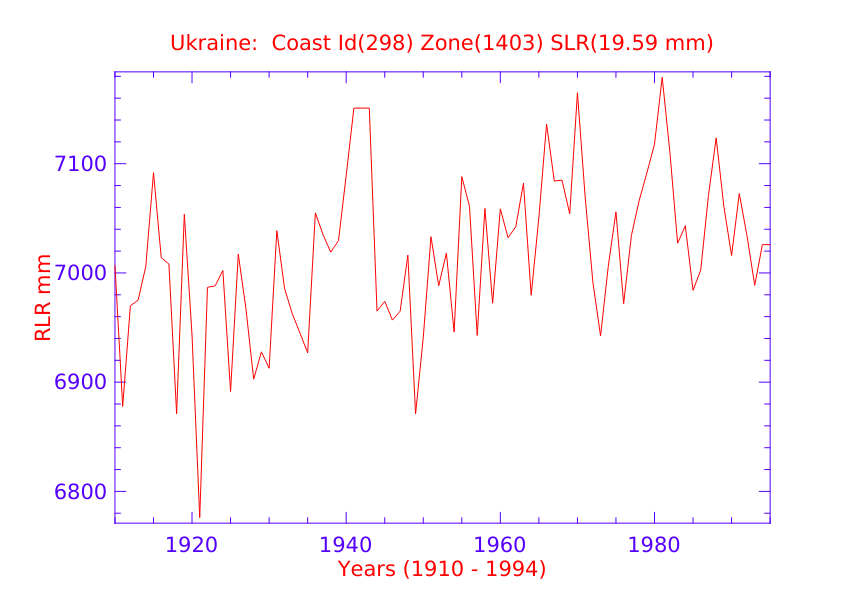
The menu below links to HTML data (first two columns) and to PNG graphs made from that same data.
Some countries have only one coastline, thus one coastline number, while others have two or more.
The menu below categorizes the countries by single and/or multiple coastlines.
The country names are arranged in alphabetical order.
III. Using The Seaport & Sea Level Data
Data analysis is a matter of simply looking at the HTML and graph data which contain: 1) a list of seaports in the WOD Zone, 2) links to websites that have information about those ports, 3) a list of Tide Gauge Stations in the WOD Zone, 4) links to PSMSL data about each Tide Gauge Station in that zone, 5) information about the duration, scope, and scale of the sea level changes, 6) a discussion of the Cryosphere influences on those sea level changes, 7) links to discussions of land surface sinking/rising, 8) a graph of the PSMSL RLR sea levels in "RLR millimeters", 9) a graph of the exact millimeter sea level changes in that zone, and 10) the Coast Id (or Ids in cases of countries with multiple Coast types).
IV. New To Sea Level Data Exposure?
 |
| Sea level is not like a bathtub |
Many people are still persuaded of "the bathtub model" myth about sea level.
That mythical belief is that the sea level of the Earth is like the water in a bathtub in the sense that, when water is added or removed, the surface will even out all across the bathtub and the oceans.
That is the furthest thing from the truth, whether or not one is talking about the results of sea level change or tides (e.g. lunar tides What Causes Tides).
Notice in the high and low tide photo above (and the link) that it is not high tide or low tide everywhere on Earth at the same time, not like a bathtub water level.
Similarly, as the appendices show, sea level change is in the form of sea level fall in some locations on Earth, but sea level change is in the form of sea level rise in other locations on Earth (it depends on proximity to ice sheets).
Watch the video given by Professor Mitrovica of Harvard University (on the issue of sea level change).