 |
| Fig. 1 The Pelagic Depths |
The reason those issues are so important is that global sea level change (SLC) and OHC are impacted by the global climate system (The Damaged Global Climate System, 2, 3, 4, 5, 6).
The warming commentariat and research scientists have been informed of the errors in ocean models that measure OHC (McDougall, 2003, Patterns: Conservative Temperature & Potential Enthalpy, TEOS).
The problem in those models is that they measure an antiquated and error prone variable ("potential temperature") which came about some four decades ago.
The new and highly accurate variable for detecting and observing OHC and OHF that replaces "potential temperature" is "Conservative Temperature" as follows:
"The Intergovernmental Oceanographic Commission (IOC), with the endorsement of the Scientific Committee on Oceanic Research (SCOR) and the International Association for the Physical Sciences of the Oceans (IAPSO), has adopted(TEOS-10 Working Group, emphasis added, PDF). Who cares about consistency and two orders of magnitude of accuracy?
Fig. 2 Epipelagic
Fig. 3 Mesopelagic
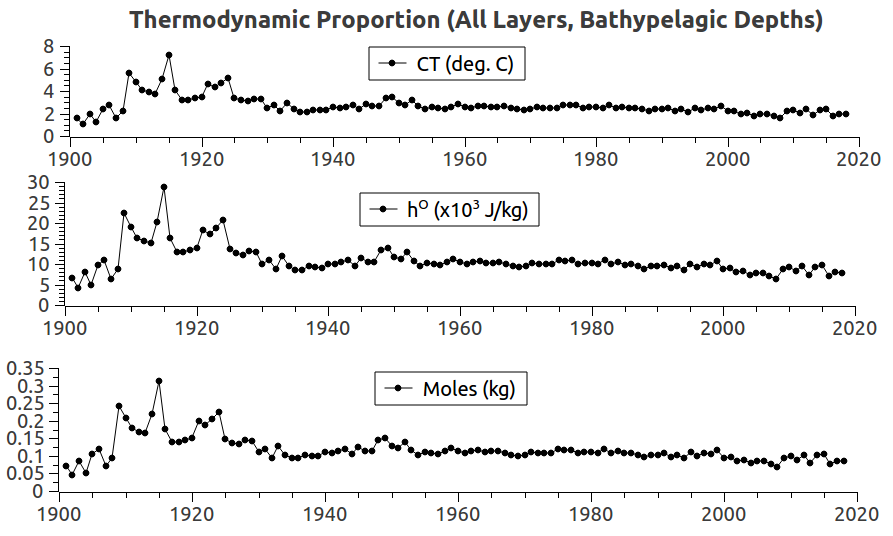
Fig. 4 Bathypelagic
Fig. 5 Abyssopelagic the International Thermodynamic Equation Of Seawater - 2010 (TEOS-10) as the official description of seawater and ice properties in marine science. All oceanographers are now urged to use the new TEOS-10 algorithms and variables to report their work.
Fig. 6 Hadopelagic
Notable differences of TEOS-10 compared with EOS-80 are:
(1) the use of Absolute Salinity SA to describe the salinity of seawater; Absolute Salinity takes into account the spatially varying composition of seawater. In the open ocean, the use of this new salinity has a non-trivial effect on the horizontal density gradient, and thereby on the ocean velocities calculated via the “thermal wind” relation.
(2) the use of Conservative Temperature Θ to replace potential temperature. Both of these temperatures are calculated quantities that result from an artificial thought experiment (namely, adiabatic and isohaline change in pressure to the sea surface). Conservative Temperature has the advantage that it better represents the “heat content” of seawater by two orders of magnitude.
(3) the TEOS-10 properties of seawater are all derived from a Gibbs function (by mathematical processes such as differentiation) and so are totally consistent with each other (in contrast to the now obsolete EOS-80 approach where separate polynomials were provided for each thermodynamic variable and they were not mutually consistent)."


That consistency and accuracy, which is also called "thermodynamic proportion" correctly identifies, calculates, and matches OHC and OHF through all ocean depths and configurations.
On to the graphs.
In the graphs at Fig. 2 - Fig. 6 you can see, right down to the deepest depths and right down to the infrared photon level, that the Conservative Temperature (top graph line), Potential Enthalpy (middle graph line), and photon patterns (bottom graph lines) match.
Can you say "absolute synchronization and accuracy" at two orders of magnitude better than the "old way" of doing oceanography?!
The patterns show different values (CT is not the same value as hO, hO is not the same value as moles of photons) but the same graph line pattern exists at those different depth levels.
This means that even though the OHC and OHF values vary with depth (higher or lower temperature, salinity, heat content, and heat flux), nevertheless the three variables shown remain in an exact pattern of consistent relation to each other at each of those pelagic levels.
On to the photons.
I mentioned "moles of photons" earlier, so let me add two links now (How to Figure the energy of one mole of photons, Two Equations Governing Light's Behavior).
One of the articles uses "Light's Behavior" in it's title, and has this to say about it:
"There are two equations concerning light that are usually taught in high school ... E = hν"(ibid, emphasis added). So this stuff is taught in high school Dredd?
Yes, it is not "rocket science."
The OHC and OHF of the ocean is about photons in the infra red spectrum that are generally called "heat" rather than "light" because the infrared spectrum is invisible to the naked human eye:
"Infrared radiation is a type of electromagnetic radiation, as are radio waves, ultraviolet radiation, X-rays and microwaves. Infrared (IR) light is the part of the EM spectrum that people encounter(What Is Infrared?, emphasis added). The basic quantum of infrared radiation is the same as the basic quantum of visible light: the photon.most in everyday life, although much of it goes unnoticed. It is invisible to human eyes, but people can feel it as heat. [Can you say ghost photons?]
Fig. 7 Ghost Photons at work
IR radiation is one of the three ways heat is transferred from one place to another, the other two being convection and conduction. Everything with a temperature above about 5 degrees Kelvin (minus 450 degrees Fahrenheit or minus 268 degrees Celsius) emits IR radiation. The sun gives off half of its total energy as IR, and much of its visible light is absorbed and re-emitted as IR, according to the University of Tennessee."
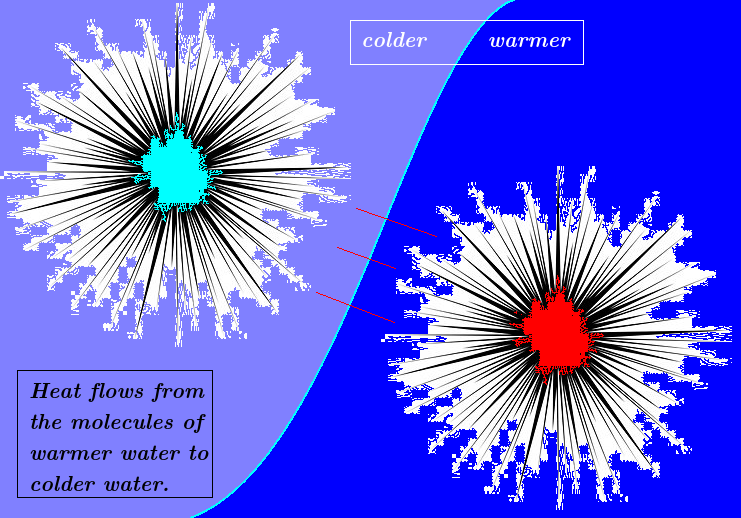
So, the patterns in today's graphs are patterns of photons, measurements of heat content, and measurements of heat flux, because heat is transferred by large numbers of photons from warmer seawater to colder seawater (The Ghost Photons; cf. Fig. 7).
The use of the measurement "a mole" of photons in the graphs is because there are so many of them (even more than the Republicans want to spend on duh wall: Snoring While Woke - 3).
If you want to know how many infrared photons per kilogram (kg) of seawater are involved in OHF simply multiply the mole amount indicated in the graphs by "Avogadro's Number" (6.02 x 10²³).
The next post in this series is here, the previous post in this series is here.
Speaking of "the down under" (as he sings, listen with the lyrics here) ...


