 |
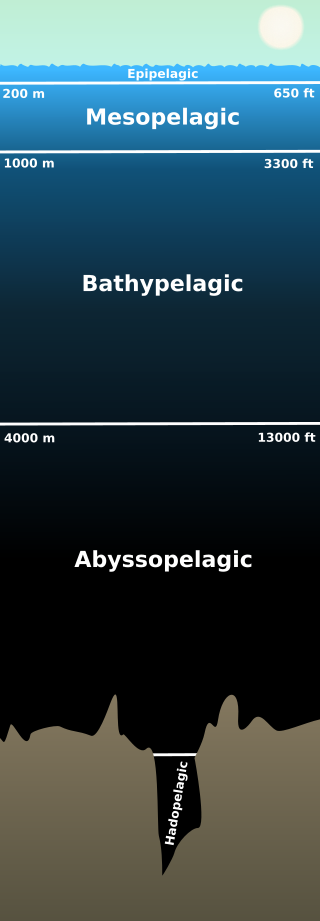
| Pelagic Depths |
One thing you notice, when reading about the deep ocean, is that at some fairly shallow ocean depth if you go any deeper, generally from there on down, the ocean does not have photons of the
visible light spectrum (
NASA, Visible Light).
So, take a flashlight with you, or use
infrared photons like the
abiotic and biotic entities there do:
"Most sunlight striking the Earth is absorbed by its surfaces, oceans and atmosphere. As a result of this warming, infrared radiation is emitted constantly all around us-estimated to be millions of Gigawatts per second ... infrared heat can be harvested 24 hours a day. One way to achieve this is to treat waste or infrared heat as high-frequency electromagnetic waves ... When we became aware of bacteria using infrared light to photosynthesize, we felt very curious about checking the photosynthetic potential with this light ... Photosynthesis — the harvesting of sunlight to produce energy — is the ultimate driver of virtually all life on the surface of our planet. Most photosynthetic creatures rely on optical light, the kind we see, to energize their biological machinery. Yet some can make use of lower-energy (and invisible to our eyes) infrared light. And in the case of one kind of bacteria — discovered years ago, deep underwater near a hydrothermal vent — this light need not even come from the Sun."
(
Phys Org, emphasis added). The search for "ocean heat" will get you to wondering how much of "it" there is, and even where "it" is at.
For some reason a group of concerned scientists expressed it this way:
"Since 1955, over 90% of the excess heat [e.g. Levitus et al., 2012] trapped by greenhouse gases has been stored in the oceans ... The remainder of this energy goes into melting sea ice, ice caps, and glaciers, and warming the continents's land mass. Only the smallest fraction of this thermal energy goes into warming the atmosphere. Humans thus, living at the interface of the land, ocean and atmosphere, only feel a sliver of the true warming cost of fossil fuel emissions ... The ocean absorbs most of this 'anthropogenic heat' because:
1. Water has a high heat capacity: It takes much more heat to warm 1 liter of water than it does to warm the same volume of air (or most other substances).
2. The ocean is deep: The world's oceans cover 71% of the earth surface and are about 4 km deep on average. This represents a tremendous reservoir of heat.
3. The ocean is dynamic: Heat, carbon, oxygen and various other quantities exchanged with the atmosphere are mixed throughout the ocean through currents, internal waves, eddies, and various other circulation mechanisms."
(
Ocean Scientists for Informed Policy, emphasis added). So, put the two together ("
Since 1955, over 90% of the excess heat ... trapped by greenhouse gases has been stored in the oceans" ...
"Most sunlight striking the Earth is absorbed by ... oceans ...) and we are off to the ocean's depths.
While still in the heat of the search I ran across some more
missing parts of this puzzle (
The Ghost Photons,
2;
The Ghost Plumes,
2,
3,
4,
5,
6,
7).
In so doing, among other things, I had discovered that the proper scientific name for ocean heat was "Potential Enthalpy", which is part of at least
a trio.
The other two members of the trio being "Conservative Temperature" and "infrared light" a.k.a. "infrared heat" or "infrared photons" (
Patterns: Conservative Temperature & Potential Enthalpy,
2,
3).
Today, I present the variables first detailed at length in those posts, but in
a different configuration.
The new configuration reveals that
ocean heat really is linked to infrared photons, from the surface to the ocean bottom, and increasingly so with increasing depth.
But "there are none so blind as those who refuse to see", so I present some more graphs with a different configuration to show
the pattern of proportionality that
Conservative Temperature,
Potential Enthalpy, and
Infrared Photons have in common.
Absolute Salinity is also included to show that
it is not bound to ocean heat content in the
thermodynamic proportion of the others.
The
global average view graphs are in this post below, but the individual layer graphs are not.
As in the previous post I mentioned ("
Patterns: Conservative Temperature & Potential Enthalpy - 3"), today there are also
Five Appendices that cover the global ocean, one section at a time.
So, let's move on to the global average graphs composed of data from all WOD layers.
 |
| WOD Layers |
The Global Average Graphs (At Pelagic Depths)
In the following menu,
the polar layers (0, 1, 2, 15, & 16) are placed into one appendix because they do not have the full pelagic depths as the others do.
The non-polar layers are presented in sequence, each having the full pelagic depth levels presented.
Click on the link of the appendix with the graphs you want to see, and the appendix will appear in a new tab for your perusal:
| Layers | Appendix |
| All | this post |
| 0, 1, 2, 15, & 16 | A-One |
| 3, 4, & 5 | A-Two |
| 6, 7, & 8 | A-Three |
| 9, 10, & 11 | A-Four |
| 12, 13, & 14 | A-Five |
Notice that the graph lines on the different graphs in the appendices have
a matching pattern (they are in sync).
That pattern involves
ocean heat content (except for Absolute Salinity, which is not bound to the thermodynamic heat proportionality as the others are).
Ocean heat content is subject to a lot of consideration these days, so check out the graphs (click on the to enlarge them):
 |
| Conservative Temperature (CT) |
 |
| Potential Enthalpy (hO) |
 |
| Infrared Photons (IR ℽ) |
 |
| Absolute Salinity (SA) |
The next post in this series is
here, the previous post in this series is
here.


