 |
| Fig. 1 WOD layers |
Their solution was to use in situ measurements of the atmosphere in order to estimate ocean heat content (Beware of Double Downers, On Resplandy Et Alia (2018), 2).
According to their thinking, our in situ measurements of ocean conditions (e.g. temperature & salinity) were defective, too few, or otherwise not the best way to detect ocean heat content.
Other competent researchers have indicated that there is work to be done in that area of oceanography.
The criticism of both teams was in terms of ocean heat content:
"The quest in this work is to derive a variable that is conservative, independent of adiabatic changes in pressure, and whose conservation equation is the oceanic version of the first law of thermodynamics. That is, we seek a variable whose advection and diffusion can be interpreted as the advection and diffusion of ‘heat.’ In other words, we seek to answer the question, ‘what is heat’ in the ocean?(Potential Enthalpy: A Conservative Oceanic Variable for Evaluating Heat Content and Heat Fluxes, McDougall 2003, pp. 945-46, emphasis added; cf. TEOS-10 gsw_CT_from_pt). So, in this post and in its graphs (Fig. 3a - Fig. 3e) potential enthalpy is presented as a valid calculation of the 'heat content' in the ocean.
...
The variable that is currently used for this purpose in ocean models is potential temperature referenced to the sea surface, θ, but it does not accurately represent the conservation of heat because of (i) the variation of specific heat with salinity and (ii) the dependence of the total differential of enthalpy on variations of salinity.
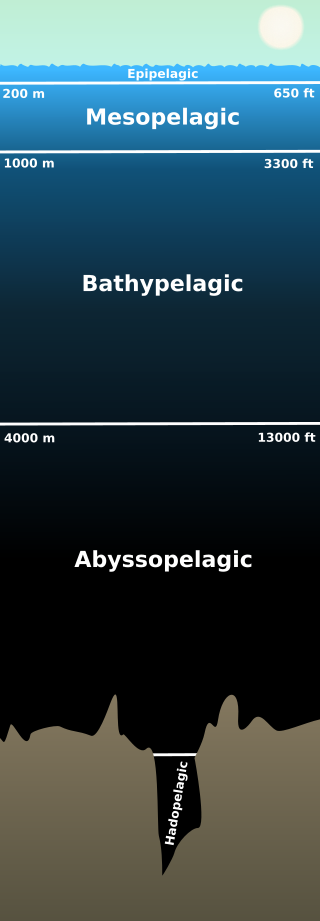
Fig. 2 Pelagic depths
...
For example, an increase in pressure of 107 Pa (1000 dbar), without exchange of heat or salt, causes a change in enthalpy that is equivalent to about 2.5ЊC. We show in this paper that in contrast to enthalpy, potential enthalpy does have the desired properties to embody the meaning of the first law.
...
Present treatment of oceanic heat fluxes is clearly inconsistent. Ocean models treat potential temperature as a conservative variable and calculate the heat flux across oceanic sections using a constant value of heat capacity. By contrast, heat flux through sections of observed data is often calculated using a variable specific heat multiplying the flux of potential temperature per unit area (Bryan 1962; Macdonald et al. 1994; Saunders 1995; Bacon and Fofonoff 1996). Here it is shown that the theoretical justification of this second approach is flawed on three counts. While the errors involved are small, it is clearly less than satisfactory to have conflicting practices in the observational and modeling parts of physical oceanography, particularly as an accurate and convenient solution can be found.
...
it is perfectly valid to talk of potential enthalpy, h0, as the 'heat content' ...”
 |
| Fig. 3a |
 |
| Fig. 3b |
 |
| Fig. 3c |
 |
| Fig. 3d |
 |
| Fig. 3e |
A WOD layer is simply a list of WOD Zones (36 zones per layer) at 10 degree high latitude bands across the globe.
The distribution shown gives a polar, equatorial, and in-between look at heat content in both hemispheres.
The potential enthalpy (h0) is calculated as specific enthalpy (h) minus dynamic enthalpy (h‡) using two TEOS-10 functions:
h‡ = gsw_dynamic_enthalpy
h0 = h - h‡
The values are divided by 1000 to make the left-side numbers on the graph smaller so they take up less space on the graphs, (hence the x 103 notation).
Notice that the 'heat content' is not uniform at equal depths in all locations.
Polar shallows (epipelagic) have less heat content (J / kg) than deeper depths (bathypelagic & abyssopelagic), but non-polar layers tend to have less heat content as the depths increase.
The bottom line is that there is enough data with which to use TEOS-10 functions to calculate the heat dynamics in the oceans.
By that I mean the heat content in terms of Joules per kilogram (J / kg) over spans of many years.
No matter how we look at it, we find that the poles have less "heat" on the surface, but have more "heat" (a.k.a. "less cold") impacted water at the deeper depths.
This is the result of the significant ocean currents circling Greenland & Antarctica preparing to disintegrate or melt the many tidewater glaciers there (Antarctica 2.0, 2, 3, 4, 5, 6 [& supplements A, B, C, D, E, F]; Mysterious Zones of Antarctica - 3; Mysterious Zones of The Arctic - 3).
 |
| Fig. 4 Mean Average All Zones |
The graph at Fig. 4 shows the mean average of all WOD Zones in all layers (0-16) ... 17 has no data.
We don't have to look for less cold water to melt the great ice sheets that jut into the Antarctic waters.
There is already plenty of "heat" to do the job (Government Climate Change Report, 2, 3, 4, 5, 6, 7, 8, 9, 10, 11).
The latest Government Climate change report released Friday (in order to try to hide it?), has the characteristic of getting very serious (A Grave Climate Warning, Buried on Black Friday).
Officialdom can't say it was not warned, but it can say it did not heed the warnings.
The next post in this series is here.


