 |
| West Indian Ocean [Area A] |
 |
| East Indian Ocean [Area B] |
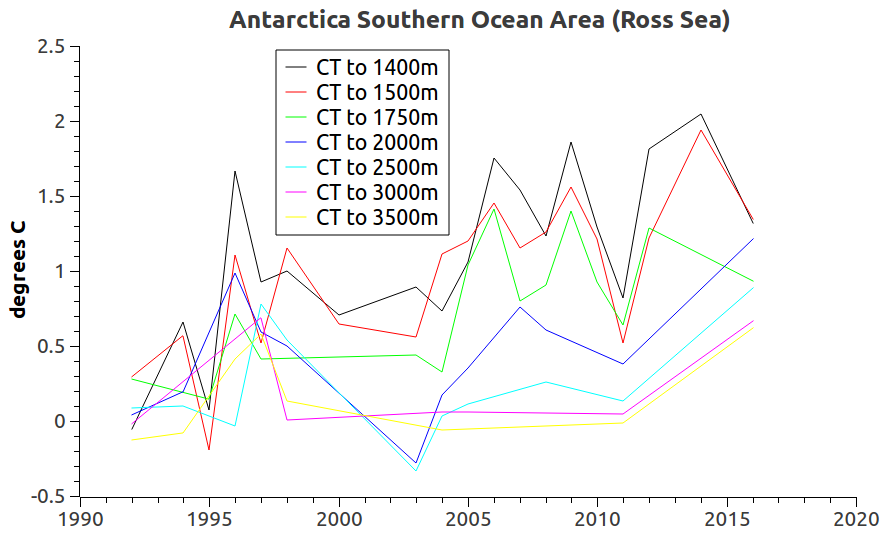 |
| Ross Sea [Area C] |
 |
| Amundsen Sea [Area D] |
 |
| Bellingshausen Sea [Area E] |
 |
| Weddell Sea [Area F] |
I. Background
This will be the last post in this series (unless something unexpected comes up).
Only the graphs of the final depths will be featured in this post.
If you want to look at the general map layout of the six Antarctica zones featured in this series, see one or more of the previous posts (Mysterious Zones of Antarctica, 2, 3).
Those readers who have already perused one or more of the previous posts know that this is a story about the most powerful current on the planet.
It is a current that has more moving water in it than all of the land based rivers on Earth combined (think Mississippi, Columbia, Colorado, Amazon, Nile, and many others).
In short, this series is about the world's most powerful ocean current which is mightily bringing warmer water to the world's largest ice sheet.
And so, in the final analysis this is the most certain source of the demise of civilization (Civilization Is Now On Suicide Watch, 2, 3, 4, 5, 6, 7, 8).
I say the "most certain source" because the other contender, all out nuclear war, is less certain only because it is more easily avoided.
Nevertheless, just because nuclear war is more easily avoided does not mean it will not happen before the disintegration of Antarctica's tidewater glaciers have destroyed the world's seaports (Greenland & Antarctica Invade The United States, 2, 3, 4; Why Sea Level Rise May Be The Greatest Threat To Civilization, 2, 3, 4, 5).
Unlike coastal cities and towns where people can migrate inland, this civilization's foundation of sea trade cannot be re-engineered to be mobile enough so as to be able to move inland easily (The Extinction of Robust Sea Ports, 2, 3, 4, 5, 6, 7, 8, 9).
Add to that the fact that sea level change varies a lot from nation to nation, and even within nations, the engineering challenge is all the more difficult.
 |
| West Indian Ocean [Area A] |
 |
| East Indian Ocean [Area B] |
 |
| Ross Sea [Area C] |
 |
| Amundsen Sea [Area D] |
 |
| Bellingshausen Sea [Area E] |
 |
| Weddell Sea [Area F] |
II. Not The First Time
Current civilization is like ancient Phoenicia because we too are a civilization based on sea trade which is based on seaports:
(The Extinction of Robust Sea Ports - 3). Like the mighty current featured in this series, the mighty seaports are the critical organs of this civilization:Of all the ancient civilizations, perhaps ours is more like the Phoenicians than some of the others:
The Phoenicians were a great maritime people, known for their mighty ships ... The island city of Tyre and the city of Sidon were the most powerful states in Phoenicia ... Phoenicia thrived as a maritime trader and manufacturing center from c.1500-332 BCE and was highly regarded for their skill in ship-building, glass-making, the production of dyes, and an impressive level of skill in the manufacture of luxury and common goods.(Phoenicia, cf. Carthage). The current version of "International Trade Civilization" is truly global, not regional like Phoenicia was:
Liner shipping could lay claim to being the world's first truly global industry. Likewise it could claim to be the industry which, more than any other makes it possible for a truly global economy to work. It connects countries, markets, businesses and people, allowing them to buy and sell goods on a scale not previously possible.(World Shipping, emphasis added; cf. Global Container Fleet, Shipping Ports). As go the shipping ports, so goes "International Trade Civilization" (Confusing "Civilization" With "Species").
I am not saying that the human, or any other species, is not threatened, they certainly are, I am saying that in the sequence of events current civilization goes first.
The reality is that current civilization's cardiovascular system (seaports and sea lanes) is the dynamic to watch, and to watch very closely:(The Extinction of Robust Sea Ports - 4). Ninety-Five percent is one figure, other nations will vary above and below that percent, but all nations face the problem together.
"By volume, more than 95 percent of U.S. international trade moves through the nation's ports and harbors, with about 50 percent of these goods being hazardous materials."(Why Sea Level Rise May Be The Greatest Threat To Civilization - 5). Current civilization would destabilize and disappear virtually overnight if seaports were substantially debilitated.
Seaports are the place where the true lifeblood, international trade goods, flow in and out of the orifices of civilization around the world.
As seaports fail one by one, the system will suffer more and more stress as other seaports struggle to handle the increased load (ongoing example of such stress).
III. The Graphs
The graphs in the upper left hand column detail the seawater temperatures from the previous post's maximum depth of 1300 meters on down to the depth of 3500 meters.
The graphs in the lower right hand column detail the seawater temperatures from >3500 meters down to where the measurements stop, which at this time is maxed out at 5000 meters (16,404.2 feet, 3.11 miles).
The current we are perusing is The Antarctic Circumpolar Current (ACC), which flows from the ocean surface down to a maximum depth of about 4000 meters ("The ACC extends from the sea surface to depths of 2000-4000 m").
The graphs in this series show that most of the seawater temperature around Antarctica is warm enough to melt the tidewater glaciers at those depths.
Thus, the graphs confirm that assessment of the impacts of the ACC on them.
Below that general depth of 4000 meters there is little temperature variation (generally less than a degree of temperature change per depth level).
IV. Conclusion
Watch Antarctica.
This series covers an important subject, because as goes the tidewater glaciers of Antarctica, so goes civilization as we know it.
The previous post in this series is here.


