Saturday, September 11, 2021

Quantum Oceanography - 13

Fig. 1 Antarctic Areas

I. Review

This series has been focused on the heat content of seawater, in terms of the potential to emit that heat in the form of infrared photons (Quantum Oceanography, 2, 3, 4, 5, 6, 7, 8, 9, 10, 11, 12; The Ghost Photons; The Photon Current).

In some of the recent posts the issue of the location of infrared photons in seawater was focused on, in terms of whether those photons were primarily located in the water molecules or in the 'salt' molecules, or maybe both.

This is an important issue for successfully understanding the dynamics of how seawater freezes, as well as for grasping the dynamics of how seawater melts glacial ice in and around Antarctica in the Southern Ocean (Fig. 1, Fig. 2).

II. Seawater Temperatures Near Tidewater Glaciers

Today's set of graphs (Fig. 3 - Fig. 8) show the seawater temperature impacting the 'grounding line' ice of Antarctic 'ice sheets'.

An 'ice sheet' is where the ice flows along the ground of the continent down to the coastal area of the Southern Ocean where they become 'tidewater glaciers'.

Fig. 2 WOD Zones within Antarctic Areas

The 'grounding line' is the point where 'tidewater glaciers' leave the ground or seabed to float.

The area of the tidewater glacier that is floating on the ocean is not called an 'ice sheet', rather, it is called an 'ice shelf'.

Most of the melting of the glacial ice takes place at the face of tidewater glaciers at or above their 'grounding line' .

As you can see from the graphs (Fig. 3 - Fig. 8), the seawater along the grounding line and above it along the face of the tidewater glaciers is warm enough to melt the ice.

The graph lines at the bottom of the graphs indicate the melting point of the glacial ice, while the lines at the upper portion of the graphs indicate the 'CT' of the seawater ('CT' means Conservative Temperature).

III. Ice Sheets Are Not Frozen Seawater

Fig. 3 Western Pacific Area B

The ice sheet is frozen fresh water, and the ice shelf is close to the same.

During Antarctic winters the temperature is cold enough to freeze the surface of the Southern Ocean surrounding it.

When that seawater freezes, what happens is basically a separation of the water from the salt.

In other words, the water goes in one 'direction', but the minerals ('salinity') go in another 'direction': "Ocean water freezes just like freshwater, but at lower temperatures. Fresh water freezes at 32 degrees Fahrenheit but seawater freezes at about 28.4 degrees Fahrenheit, because of the salt in it. When seawater freezes, however, the ice contains very little salt because only the water part freezes. It can be melted down to use as drinking water" (Can the ocean freeze?).

The 'direction' I mentioned is that upon freezing the water portion of seawater goes upward because it is less dense than the brackish brine that goes downward.

Fig. 4 Weddell Sea Area F

What this means is that the upward moving now-fresh water can refreeze to become the lower portion of the ice shelf, but the now very salty brine won't refreeze.

IV. The 'Warm' Water

As you can see from the graphs, the temperature of the seawater is warmer as the depth increases (at least up to a point).

The surface to 200 meters down is the Epipelagic, below that to 1,000 meters is the Mesopelagic, and below that down to 4,000m is the Bathypelagic (Pelagic zone).

These warmer depths (see graphs) cover most of any tidewater glacier grounding line depths, and above, so a lot of melt is taking place along the ~58,000 kilometers of Antarctica's Tidewater Glaciers.

V. The Infrared Photons

I found a research paper that probably answers the question "does the water absorb, harbor, and radiate the infrared photons (a.k.a. "potential enthalpy" or "ocean heat") or does the 'salinity' part of seawater do it?":

Fig. 5 Ross Sea Area C

"The analysis by infrared spectroscopy of aqueous solutions of the binary inorganic salts NaI and NaCl and the ternary salts CaCl2 and BaCl2 at concentrations from 1000 to 2mM was carried out to complement a previous study done at higher concentrations on nine binary salts (alkali halides) and one ternary salt (MgCl2) [J.-J. Max and C. Chapados, J. Chem. Phys. 115, 2664 (2001)]. These salts are completely ionized in aqueous solutions, forming monoatomic species that do not absorb IR [infrared]"

(Scitation Org, emphasis added). That is a reasonable conclusion in the sense that the pure water is about 96.5% and the salinity is about 3.5% of seawater:

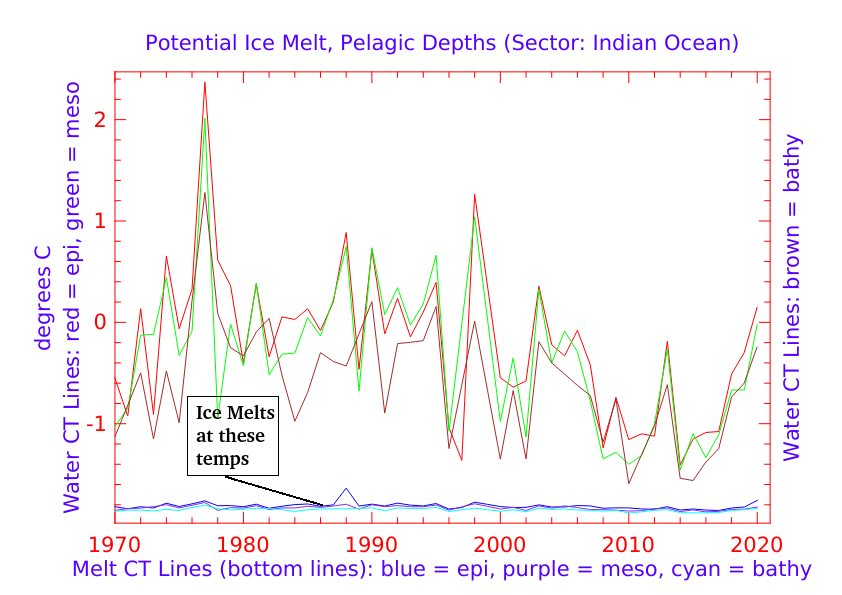
Fig. 6 Indian Ocean Area A

"The infrared spectrum of liquid water is dominated by the intense absorption due to the fundamental O-H stretching vibrations. Because of the high intensity, very short path lengths, usually less than 50 μm,are needed to record the spectra of aqueous solutions. There is no rotational fine structure, but the absorption bands are broader than might be expected, because of hydrogen bonding.​ Peak maxima for liquid water are observed at 3450 cm−1 (2.898 μm), 3615 cm−1 (2.766 μm) and 1640 cm −1 (6.097 μm). Direct measurement of the infrared spectra of aqueous solutions requires that the cuvette windows be made of substances such as calcium fluoride which are water-insoluble. This difficulty can alternatively be overcome by using an attenuated total reflectance (ATR) device rather than transmission."

Fig.7 Bellingshausen Sea Area E

"In the near-infrared range liquid water has absorption bands around 1950 nm (5128 cm−1), 1450 nm (6896 cm−1), 1200 nm (8333 cm−1) and 970 nm, (10300 cm−1). The regions between these bands can be used in near-infrared spectroscopy to measure the spectra of aqueous solutions, with the advantage that glass is transparent in this region, so glass cuvettes can be used. The absorption intensity is weaker than for the fundamental vibrations, but this is not important as longer path-length cuvettes can be used. The absorption band at 698 nm (14300 cm−1) is a 3rd overtone (n=4). It tails off onto the visible region and is responsible for the intrinsic blue color of water. This can be observed with a standard UV/vis spectrophotometer, using a 10 cm path-length. The colour can be seen by eye by looking through a column of water about 10 m in length; the water must be passed through an ultrafilter to eliminate color due to Rayleigh scattering which also can make water appear blue."

Fig. 8 Amundsen Sea Area D

"The spectrum of ice is similar to that of liquid water, with peak maxima at 3400 cm−1 (2.941 μm), 3220 cm−1 (3.105 μm) and 1620 cm−1 (6.17 μm) ... In both liquid water and ice clusters, low-frequency vibrations occur, which involve the stretching (TS) or bending (TB) of intermolecular hydrogen bonds (O–H•••O). Bands at wavelengths λ = 50-55 μm or 182-200 cm−1 (44 μm, 227 cm−1 in ice) have been attributed to TS, intermolecular stretch, and 200 μm or 50 cm−1 (166 μm, 60 cm−1 in ice), to TB, intermolecular bend"

...

"The extra bonding between water molecules also gives liquid water a large specific heat capacity. This high heat capacity makes water a good heat storage medium (coolant) and heat shield." 

...

"Water is relatively transparent to visible light, near ultraviolet light, and far-red light, but it absorbs most ultraviolet light, infrared light [infrared photons], and microwaves."

(Wikipedia, Electromagnetic absorption by water, emphasis added). The H2O portion of seawater at ~96.5% carries the "potential enthalpy" in the form of infrared photons much more so than does the ~3.5% salinity portion.

VI. Closing Comments

This research in this series has been useful at informing us of the reality of what is taking place at Tidewater Glaciers in Antarctica. (cf. On the interpretation of the steric and mass components of sea level variability: The case of the Mediterranean basin; Steric sea level variations during 1957–1994: Importance of salinity).

Quantum Oceanography matters (see video below).

The next post in this series is here, the previous post in this series is here.


Wednesday, September 8, 2021

Call for Emergency Action

Caldor

Call for Emergency Action to Limit Global Temperature Increases, Restore Biodiversity, and Protect Health:

"The United Nations General Assembly in September 2021 will bring countries together at a critical time for marshalling collective action to tackle the global environmental crisis. They will meet again at the biodiversity summit in Kunming, China, and at the climate conference (COP26) in Glasgow, United Kingdom. Ahead of these pivotal meetings, we — the editors of health journals worldwide — call for urgent action to keep average global temperature increases below 1.5° C, halt the destruction of nature, and protect health.

Health is already being harmed by global temperature increases and the destruction of the natural world, a state of affairs health professionals have been bringing attention to for decades.1 The science is unequivocal: a global increase of 1.5° C above the pre-industrial average and the continued loss of biodiversity risk catastrophic harm to health that will be impossible to reverse.2,3 Despite the world’s necessary preoccupation with Covid-19, we cannot wait for the pandemic to pass to rapidly reduce emissions.

Reflecting the severity of the moment, this editorial appears in health journals across the world. We are united in recognizing that only fundamental and equitable changes to societies will reverse our current trajectory."

(New England Journal of Medicine, emphasis added).

The next post in this series is here.

Tuesday, September 7, 2021

Seaports With Sea Level Change - 17


"Truth is never the fault
of the messenger
.
"
The Permanent Service for Mean Sea Level (PSMSL) keeps records of sea level change (SLC) around the world.

Today's post is an update of their latest data (August 30, 2021).

Today's post is limited to the sea level changes (sea level rise and fall) that are clearly taking place along the coastlines of the many nations where those seaports are now located.

Previous posts in this series have covered this issue from various viewpoints (Seaports With Sea Level Change - 16).

Today, I thought I would update the series with more recent PSMSL data, so here is a table of appendices with both HTML data and sea level change graphs:

(HTML) Single
Coastline Countries
(HTML) Multi
Coastline Countries
Coastline Graphs
Appendix: A-CAppendix: A-CAppendix: A-C
Appendix: D-GAppendix: D-GAppendix: D-G
Appendix: H-LAppendix: H-LAppendix: H-L
Appendix: M-OAppendix: M-OAppendix: M-O
Appendix: P-TAppendix: P-TAppendix: P-T
Appendix: U-ZAppendix: U-ZAppendix: U-Z

The graphs show that some areas have varying degrees of sea level rise while other areas have varying degrees of sea level fall. (NOTE: "(HTML) Single
Coastline Countries Appendix:D-G
" links to a previous appendix of the same data).

I am not talking about tides, which they also have, I am talking about long range rising and falling of sea level.

This is caused by the melting of the Cryosphere in areas near the oceans.

Those areas such as Greenland, Antarctica, and Glacier Bay (Alaska) have sufficient mass and gravity to pull the ocean toward them, thereby raising the ocean level there.

As those areas melt, their mass and gravity diminishes so they lose their hold on that water, and it flows away from them causing sea level fall there and sea level rise elsewhere (The Bathtub Model Doesn't Hold Water, 2, 3).

Plus, thermal expansion is not 'the' or 'a' major cause of sea level change (The Young Old Sea Level Change Hoax). 

And finally, the sea level change estimates in general have been based on inaccurate ground level data (Global vulnerability to sea level rise worse than previously understood) not to mention 'the wobble' (A 'wobble' in the moon's orbit could result in record flooding ... blame it on the moon eh?).

So, check out the video below (a presentation by Professor Mitrovica).

The next post in this series is here, the previous post in this series is here.


Appendix HTML-MULTI D-G

This is an appendix to: Seaports With Sea Level Change - 17


Country: France, Coastal Id: 190

Seaport Data:
List # Port LinkCoastline CodeWOD Zone
1Dunkerque FR DKK1901500
2Boulogne Sur Mer FR BOL1901500


Tide Gauge Data:
List # Station NameStn LinkCoastline CodeWOD Zone
1CALAIS4551901500
2DUNKERQUE4681901500
3BOULOGNE4711901500


Summary for France (Coastline Code: 190, WOD Zone: 1500):

Distance from Zone's center to Cryosphere Locations & (SLC type):

Antarctica: ~15,670.87 km (SLR)
Patagonia: ~12,259.95 km (SLR)
Glacier Bay: ~7,312.65 km (SLR)
Third Pole: ~6,943.83 km (SLR)
Greenland: ~3,270.38 km (SLR)
Svalbard: ~3,110.07 km (SLR)

SLC: 1st yr (1941) 6,994.19 RLR --> final yr (2020) 7,109.87 RLR {+115.683 mm total}

1) There is no SLF influence on the SLR total;
2) Some land level changes may take place;
3) Ghost water amount of SLR total: ~31.23 mm;
4) Third Pole Info (third largest Cryosphere area).

(France) Seaport Data:
List # Port LinkCoastline CodeWOD Zone
1Nantes-St. Nazaire FR NTE1907400
2Cherbourg FR CER1907400
3St Malo FR SML1907400
4Le Havre FR LEH1907400
5La Rochelle-Pallice FR LPE1907400
6Bordeaux FR BOD1907400


(France) Tide Gauge Data:
List # Station NameStn LinkCoastline CodeWOD Zone
1BREST11907400
2ST. MALO4541907400
3ST. NAZAIRE4571907400
4LE VERDON4591907400
5LA ROCHELLE-LA PALLICE4661907400
6CHERBOURG4671907400
7ST JEAN DE LUZ (SOCOA)4691907400
8POINTE ST. GILDAS10781907400
9PORT TUDY12471907400
10LE CONQUET12941907400
11CONCARNEAU13011907400
12ROSCOFF13471907400
13LES SABLES D OLONNE17471907400
14BOUCAU18011907400
15PORT BLOC19151907400
16ARCACHON-EYRAC19181907400
17LE CROUESTY19211907400
18ILE D'AIX22361907400


Summary for France (Coastline Code: 190, WOD Zone: 7400):

Distance from Zone's center to Cryosphere Locations & (SLC type):

Antarctica: ~15,214.39 km (SLR)
Patagonia: ~11,720.04 km (SLR)
Glacier Bay: ~7,610.44 km (SLR)
Third Pole: ~7,419.89 km (SLR)
Greenland: ~3,601.11 km (SLR)
Svalbard: ~3,599.05 km (SLR)

SLC: 1st yr (1807) 6,970.17 RLR --> final yr (2020) 7,121.12 RLR {+150.954 mm total}

1) There is no SLF influence on the SLR total;
2) Some land level changes may take place;
3) Ghost water amount of SLR total: ~40.76 mm;
4) Third Pole Info (third largest Cryosphere area).

Country: France, Coastal Id: 230

Seaport Data:
List # Port LinkCoastline CodeWOD Zone
1Toulon FR TLN2301400
2Paris FR PAR2301400
3Strasbourg FR SXB2301400
4Rouen FR URO2301400
5Marseille FR MRS2301400


Tide Gauge Data:
List # Station NameStn LinkCoastline CodeWOD Zone
1MARSEILLE612301400
2SETE9582301400
3TOULON9802301400
4NICE14682301400
5PORT VENDRES14692301400


Summary for France (Coastline Code: 230, WOD Zone: 1400):

Distance from Zone's center to Cryosphere Locations & (SLC type):

Antarctica: ~14,813.03 km (SLR)
Patagonia: ~11,876.32 km (SLR)
Glacier Bay: ~8,198.51 km (SLR)
Third Pole: ~7,067.09 km (SLR)
Greenland: ~4,158.53 km (SLR)
Svalbard: ~3,944.75 km (SLR)

SLC: 1st yr (1885) 6,850.95 RLR --> final yr (2020) 7,031.21 RLR {+180.264 mm total}

1) There is no SLF influence on the SLR total;
2) Some land level changes may take place;
3) Ghost water amount of SLR total: ~48.67 mm;
4) Third Pole Info (third largest Cryosphere area).


Country: French Polynesia, Coastal Id: 780

Seaport Data:
List # Port LinkCoastline CodeWOD Zone
1Papeete PF PPT7805114


Tide Gauge Data:
List # Station NameStn LinkCoastline CodeWOD Zone
1PAPEETE-B FARE UTE POINT SOC.IS.13977805114
2VAIRAO22427805114


Summary for French Polynesia (Coastline Code: 780, WOD Zone: 5114):


SLC: 1st yr (1976) 7,078.40 RLR --> final yr (2020) 7,046.79 RLR {-31.61 mm total}

Checking the reason for {-31.61 mm} of SLF in Zone 5114:

There is no Cryosphere location within 2,000.00 km.

So, the pseudo SLF could be due to land level change
and/or defective tide gauge records.


Country: Germany, Coastal Id: 120

Seaport Data:
List # Port LinkCoastline CodeWOD Zone
1Kiel DE KEL1201501
2Rostock DE RSK1201501
3Lubeck DE LBC1201501


Tide Gauge Data:
List # Station NameStn LinkCoastline CodeWOD Zone
1WISMAR 281201501
2WARNEMUNDE 2111201501
3SASSNITZ3971201501
4KOSEROW14481201501


Summary for Germany (Coastline Code: 120, WOD Zone: 1501):

Distance from Zone's center to Cryosphere Locations & (SLC type):

Antarctica: ~16,031.74 km (SLR)
Patagonia: ~13,062.96 km (SLR)
Glacier Bay: ~7,220.24 km (SLR)
Third Pole: ~6,134.55 km (SLR)
Greenland: ~3,224.58 km (SLR)
Svalbard: ~2,698.89 km (SLR)

SLC: 1st yr (1848) 6,949.17 RLR --> final yr (2019) 7,086.56 RLR {+137.387 mm total}

1) There is no SLF influence on the SLR total;
2) Some land level changes may take place;
3) Ghost water amount of SLR total: ~37.09 mm;
4) Third Pole Info (third largest Cryosphere area).

Country: Germany, Coastal Id: 140

Seaport Data:
List # Port LinkCoastline CodeWOD Zone
1Dusseldorf DE DUS1401500
2Emden DE EME1401500
3Wilhelmshavn DE WVN1401500
4Duisburg DE DUI1401500
5Hamburg DE HAM1401500
6Bremerhaven DE BRV1401500
7Bremen DE BRE1401500
8Brake DE BKE1401500


Tide Gauge Data:
List # Station NameStn LinkCoastline CodeWOD Zone
1CUXHAVEN 271401500
2AMRUM (WITTDUEN)10361401500
3BORKUM (FISCHERBALJE)10371401500


Summary for Germany (Coastline Code: 140, WOD Zone: 1500):

Distance from Zone's center to Cryosphere Locations & (SLC type):

Antarctica: ~16,015.50 km (SLR)
Patagonia: ~12,792.96 km (SLR)
Glacier Bay: ~7,136.39 km (SLR)
Third Pole: ~6,444.33 km (SLR)
Greenland: ~3,107.00 km (SLR)
Svalbard: ~2,730.73 km (SLR)

SLC: 1st yr (1843) 6,832.38 RLR --> final yr (2018) 7,041.34 RLR {+208.955 mm total}

1) There is no SLF influence on the SLR total;
2) Some land level changes may take place;
3) Ghost water amount of SLR total: ~56.42 mm;
4) Third Pole Info (third largest Cryosphere area).


Country: Guatemala, Coastal Id: 832

Seaport Data:
List # Port LinkCoastline CodeWOD Zone
1Champerico GT CHR8327109


Tide Gauge Data:
List # Station NameStn LinkCoastline CodeWOD Zone
1SAN JOSE II7778327109
2SAN JOSE9738327109
3CHAMPERICO12018327109


Summary for Guatemala (Coastline Code: 832, WOD Zone: 7109):


SLC: 1st yr (1960) 7,096.71 RLR --> final yr (1975) 6,920.97 RLR {-175.745 mm total}

Checking the reason for {-175.745 mm} of SLF in Zone 7109:

Zone 7109 is a Cyrosphere location.

The GLIMS glacier count recorded
for Zone 7109 is ~7.

Consider land level changes as needed.


Country: Guatemala, Coastal Id: 916

Seaport Data:
List # Port LinkCoastline CodeWOD Zone
1Santo Tomas De Castilla GT STC9167108
2Puerto Barrios GT PBR9167108


Tide Gauge Data:
List # Station NameStn LinkCoastline CodeWOD Zone
1SANTO TOMAS DE CASTILLA10809167108


Summary for Guatemala (Coastline Code: 916, WOD Zone: 7108):


SLC: 1st yr (1964) 6,935.90 RLR --> final yr (1983) 6,934.36 RLR {-1.54 mm total}

Checking the reason for {-1.54 mm} of SLF in Zone 7108:

Zone 7108 SLF is influenced by the Cryosphere area
of Zone 7107 (which is ~1,074.09 km away).

The GLIMS glacier count recorded for Zone 7107 is ~32.

Consider land level changes as needed.


Appendix SLC H-L

This is an appendix to: Seaports With Sea Level Change - 17


Appendix SLC D-G

This is an appendix to: Seaports With Sea Level Change - 17


Appendix SLC A-C

This is an appendix to: Seaports With Sea Level Change - 17