|
| Fig. 1 No low temperature records broken any more? |
I. Take A Look
Today let's take a look at the "Industrial Revolution" in terms of its impact on sea ports:
"Most historians place the origin of the Industrial Revolution in Great Britain in the middle decades of the 18th century." [i.e. circa 1750]
(Nat. Geographic, cf. here and here). One of the many things that the Industrial Revolution was based on is the use of coal as an energy source for machinery in place of wood burning (ibid).
A bit later on in "the early days" of the Industrial Revolution both the military and the non-military moved on to discover petroleum as an energy source for their machinery replacing coal:
"A few years prior to 1912, oil had been discovered in the Persian Empire:
In 1901 William Knox D'Arcy, a millionaire London socialite, negotiated an oil concession with Mozaffar al-Din Shah Qajar of Persia [now Iran]. He assumed exclusive rights to prospect for oil for 60 years in a vast tract of territory ... By 1908 having sunk more than £500,000 into their Persian venture and found no oil ... [however,] in a stroke of luck, struck oil shortly after on May 26, 1908 ... [thereafter those interested] created the Anglo-Persian Oil Company (APOC) ... Volume production of Persian oil products eventually started in 1913 from a refinery built at Abadan, for its first 50 years the largest oil refinery in the world (see Abadan Refinery). In 1913, shortly before World War I, APOC managers negotiated with a new customer, Winston Churchill [Britain], who was then First Lord of the Admiralty. Churchill, as a part of a three-year expansion program, sought to modernize Britain's navy by abandoning the use of coal. Furthermore, Churchill wanted to free Britain from its reliance on the Standard Oil [American] and Royal Dutch-Shell [Netherlands] / Dutch / Brits] oil companies. In exchange for secure oil supplies for its ships, the British government injected new capital into the company and, in doing so, acquired a controlling interest in APOC. The contract that was set up between the British Government and APOC was to hold for 20 years. The British government also became a de facto hidden power behind the oil company ...
For a good part of the last century, interests of national governments were closely linked with the interests of oil companies, so much so that oil companies were de facto extensions of foreign-office establishments of the governments. The latter actively lobbied on behalf of the oil companies owned by their respective nationals. The oil companies, in return, would guarantee oil supply to respective governments – preferably at a substantial discount.
(The Quest for Oil, emphasis added). The video at the end of this post shows some additional Ottoman Empire oil fields up in the Black Sea area that were producing prior to WW I."
(The Peak Of The Oil Wars - 10). The results of the use of coal and oil have caused unprecedented changes in human civilization.
II. Change Begets Change
One such change has been catastrophic warming temperatures in the climate of the planet Earth.
 |
| Fig. 2 This Island Is A Seaport |
Science indicates that 90-93% of the heat increase in the Earth's atmosphere flows into the cooler oceans ("hot flows to cold") which melts the tidewater glaciers.
The remaining 7-10% that doesn't flow into the oceans stays in the atmosphere to melt the Cryosphere areas on land.
That increasing atmospheric heat combined with the increasing ocean heat are what impacts seaports in several ways; one of those ways is sea level fall and another one of those ways is sea level rise (The Gravity of Sea Level Change - 6).
Another factor determining the degree the impact of sea level change, besides the location of the port is the year in which the seaport was built.
In other words the older the port is the more impact the sea level change will have had on it (UN Trade & Development).
The top UN official recently stated that "... a half degree difference in global warming could mean some island States or coastal communities disappearing forever" (There is an exit off ‘the highway to climate hell’, Guterres insists) and further said we need to hurry becaise scientists "... point out that the Greenland ice sheet and West Antarctic ice sheet could collapse and cause catastrophic sea level rise" (ibid).
The little island-seaport shown in Fig. 2 indicates that he was way past just being correct when he said "some island States or coastal communities" could disappear (e.g. Panama prepares to evacuate first island in face of rising sea levels).
The Fig. 2 overhead view of a seaport that surrounds a small Panamanian island is an example of the principles involved in sea level change.
When all of those facilities for boats were first made the sea level was much lower than it is today.
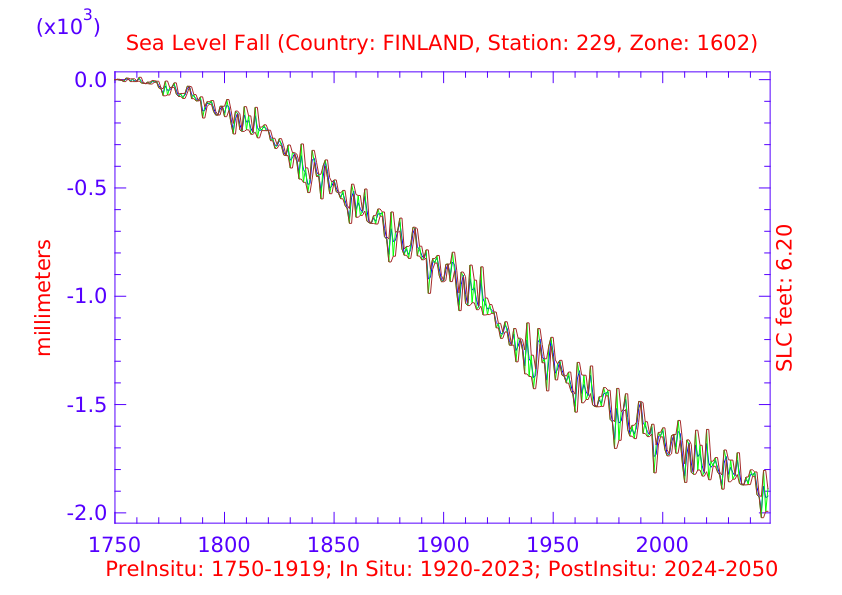
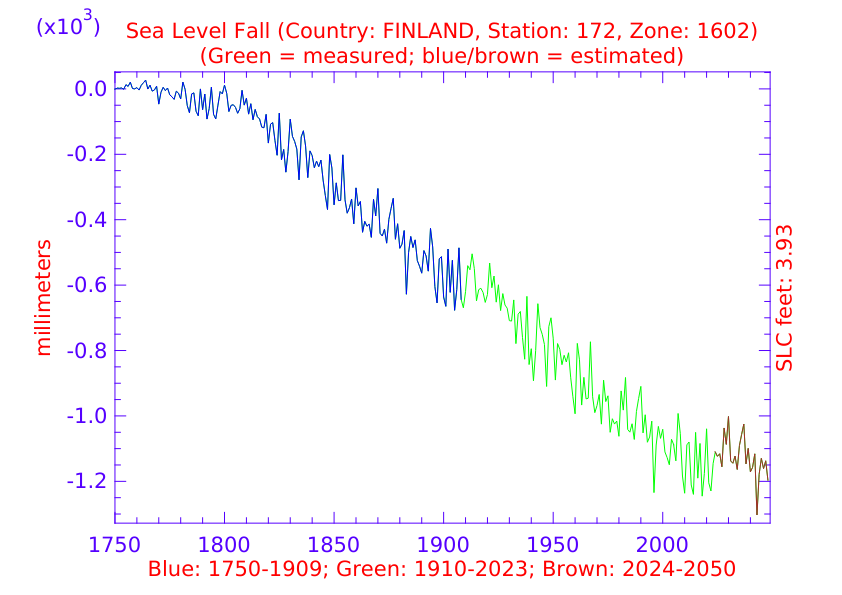
III. The Silly Millimeter
Governments and The Warming Science Commentariat love to hide the plain truth of this from us by their incessant use of "millimeter" to describe the degree of sea level change taking place.
Today's appendices use a few PSMSL stations to show that since the Industrial Revolution and up to about 26 years from now (three centuries total) we can talk in terms of feet of sea level change (Appendix DNA, Appendix NonDNA).
The same PSMSL tide gauge data was used to produce both of those two appendices.
The differences in the graphs of the two appendices is the way in which the data is presented.
The "NonDNA graph" types are single-line displays, while the "DNA graph" types have several lines which resemble the shape of DNA.
As an added bonus, the single line (NonDNA) graphs are a combination of three colored lines into a continuum of blue, green, and brown sections.
The blue section of the line is an estimate of the sea level path from 1750 (Industrial Revolution) to the sea level at the time the relevant tide gauge station began to measure the sea level shown by the green section of the complete line.
The green lines are 100 years long.
Finally, the brown section of the line is the estimated values during the time from when the tide gauge station stopped making measurements, or from 2023 if the tide gauge station is still active.
The estimations of the brown line end in the year 2050.
The estimates are extrapolations using the measurements of the green line pattern as a template for the blue line history and a template for the brown line future.
What modifies those patterns is the amount of sea level change per year.
The blue line history values diminish approaching the year 1750 because there was little to no sea level change then.
Likewise, the brown line values increase approaching the year 2050 because we now know that sea level change is accelerating.
IV. Closing Comments
The purpose of this post is to introduce some hard core reality into the things our current civilization must face.
Failure to do so is not an option, but it is a possibility (26% of Americans Say The Sun Orbits The Earth).
The next post in this series is here, the previous post in this series is here.