Friday, December 21, 2018

Patterns: Conservative Temperature & Potential Enthalpy - 2

Fig. 1 Current Events
I. Background

In the first post of this series we saw that the relationship pattern between Conservative Temperature (Θ) and Potential Enthalpy (hO) matches (Patterns: Conservative Temperature & Potential Enthalpy).

There is little wonder in that discovery, since Dr. McDougall writes in his paper that Potential Enthalpy is the "heat content" in seawater; but not only that, he points out that change in Potential Enthalpy is the heat flux of seawater (McDougall, 2003).

That proportional relationship (thermodynamic proportion) between a temperature component and a heat component (heat uptake, flux, etc.) helps us gain knowledge about one of the major concerns of oceanography today (In Search Of Ocean Heat, 2, 3).

Fig. 2 WOD Layers 15-17
If we do not know what to look for when searching for seawater "heat" then we are not likely to find it are we?

II. Today's Graphs

Now that we know what to look for in order to track heat flux all the way to the bottom of the oceans, let's get to work.

Today, I present some graphs of the ocean waters around Antarctica in WOD layers 15-17 (Fig. 2), where, as we learned in another series (Mysterious Zones of Antarctica, 2, 3, 4; The Ghost Plumes, 2, 3), the currents flowing completely around Antarctica, in Layers 15-17, transport more water in them than all the fresh water rivers on Earth combined.

That current is depicted in Fig. 1, and there is a link in that caption to a post explaining various aspects of that awesome current.

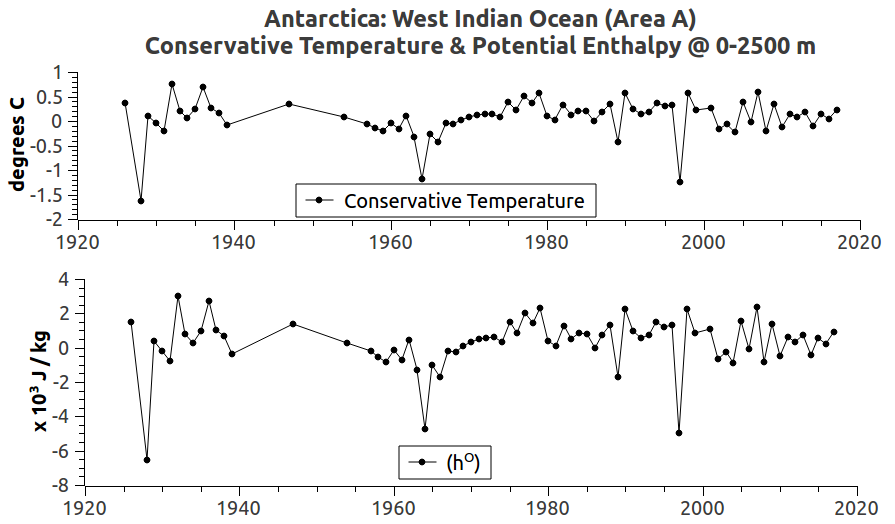
Fig. 3a West Indian Ocean (Area A)
Fig. 3b East Indian Ocean (Area B)
Fig. 3c Ross Sea (Area C)
Fig. 3d Amundsen Sea (Area D)
Fig. 3e Bellingshausen Sea (Area E)
Fig. 3f Weddell Sea (Area F)
The "areas" that the current flows through (Fig. 1 A-F) are graphed in Fig. 3a - Fig. 3f.

Those graphs show that Conservative Temperature (Θ) and Potential Enthalpy (hO) have the exact same pattern.

They have the same thermodynamic proportionality even though they have different values, plus one is temperature ( deg. C ) while the other is Joules per kilogram ( J / kg ).

Those patterns are made from in situ measurements stored in the World Ocean Database (WOD) that are calculated into Conservative Temperature (Θ) and Potential Enthalpy (hO) using the TEOS-10 toolbox.

The combined in situ measurements were taken at depths from 0 m to 2500 m for each of the zones in layers 15-17.

The depths are limited to that range because a tidewater glacier's ice face doesn't go down below sea level to that depth (2500 m) very often, if ever.

If you want to review them, those areas have been considered in other Dredd Blog posts (Mysterious Zones of Antarctica, 2, 3, 4; The Ghost Plumes, 2, 3; Antarctica 2.0 - 6, A, B, C, D, E, F).

III. Main Focus

What is so interesting to me is that the graphs show that the heat flux is due to a general increase in heat content (hO) around Antarctica.

That heat content is finding its way to the tidewater glaciers, and is melting them from the glaciers' grounding lines all the way up to and along the bottom of the floating ice shelves.

I have shown in other posts that the increasing heat content is also found at even deeper depths there.

However, since my focus is on the danger that the melting glaciers pose to seaports (The Extinction of Robust Sea Ports, 2, 3, 4, 5, 6, 7, 8, 9) I have only shown the shallow tidewater depths today (0-2500m).

Furthermore, the main purpose of today's post is to show the thermodynamic proportionality between CT and hO as harbingers of heat flux.

IV. Conclusion

As Dr. McDougall pointed out, the ocean models will continue to have errors in their heat content and heat flux computations until they replace "potential temperature" with Conservative Temperature.

While their programmers are doing that, adding Absolute Salinity and Potential Enthalpy computations a la TEOS-10 would also be steps in the direction of fewer errors.

The next post in this series is here, the previous post in this series is here.


Tuesday, December 18, 2018

How To Identify The Despotic Minority - 7

Fig. Zero Despotic Trufiness Galore
I. Background

In this series we have been focusing on the trinity that has brought down some 26 civilizations which came and went (some went down centuries prior to our current civilization).

Of those prior civilizations it has been noted that "... the civilizations then sank owing to the sins of nationalism, militarism, and the tyranny of a despotic minority" (How To Identify The Despotic Minority - 6).

Tyranny by a despotic minority can only be prevented by a ubiquitous free press leading to a well informed populace.

In the embryonic writings of our constitutional republic we see the notion of a "free press" (First Amendment).

That amendment was written prior to the outbreak of corporate media, which is decidedly not a free press now, because it is in varying degrees entangled with commercialism (Corp Germ > Corp Seed > Corp Monster, 2, 3, 4).

II. Mourning Java

This very morning, Morning Joe expanded upon the paranoia that MOMCOM has been spreading concerning what JoJo likes to call "social media" ("unsocial media" would be more accurate).

Thus, McTell News (Blind Willie McTell News, 2, 3, 4, 5, 6) is blundering through yet another revelation that "social media" carries harmful entities (Russian bots) as well as helpful entities (real good and real bad news).

After all, the "air waves" and the actual atmosphere carry both harmful virus and harmful biotic entities, as well as carrying helpful virus and helpful biotic entities (e.g. Etiology of Social Dementia - 5, The Deceit Business).

We can live in the air of this planet, so why can't we live with the "air waves" in social media (The Citizen Journalist In America, 2, 3) ?

III. Despots Anonymous

The despotic minority is composed of both geniuses and dumbbells, males and females, multiple races, and multiple good and bad political entities (How To Identify The Despotic Minority, 2, 3, 4, 5, 6).

Thus, social media culture is very much like the atmosphere and the corporate media.

Why is McTell News afraid of social media then?

Do they have a problem with a tendency to be control freaks (Mocking America, 2, 3; 4, In the Fog of The Presstitutes, 2, 3, 4) ?

IV. Conclusion

Corporate media needs to realize that the antidote is a proper educational system loaded with healthy civics, not a whiny corporate media fed with the advertising toxins of MOMCOM.

That educational need also includes a very healthy dose of global warming induced climate change reporting (MOMCOM's Mass Suicide & Murder Pact, 2, 3, 4, 5).

The next post in this series is here, the previous post in this series is here.


Monday, December 17, 2018

Patterns: Conservative Temperature & Potential Enthalpy

Fig. 1 Pelagic Depths
In the run-up to TEOS-10, which has been adopted by scientific bodies around the world as the new official standard, some key scientists pointed out why the new standard was preferred over the error prone old standard.

In today's post I want to review the reasons for the change, while showing how the "new parts" synchronize with the new whole.

By "review" I only mean that I will quote Dr. Trevor J. McDougall's paper in a slightly different way in order to focus on the errors in the old standard that were eradicated from the new standard for thermodynamics in oceanography.

I want to focus on the pattern of synchronization between Conservative Temperature and Potential Enthalpy.

As we will see, another valid way of saying that is "the pattern of synchronization between Conservative Temperature and Heat Flux" in seawater, because the old standard "Potential Temperature" was replaced with the new standard "Conservative Temperature" for reasons pointed out in the following quote:
Fig. 2a Epipelagic
Fig. 2b Mesopelagic
Fig. 2c Bathypelagic
Fig. 2d Abyssopelagic
Fig. 2e Hadopelagic
"Potential temperature is used in oceanography as though it is a conservative variable like salinity; however, turbulent mixing processes conserve enthalpy and usually destroy potential temperature. This negative production of potential temperature is similar in magnitude to the well-known production of entropy that always occurs during mixing processes. Here it is shown that potential enthalpy—the enthalpy that a water parcel would have if raised adiabatically and without exchange of salt to the sea surface—is more conservative than potential temperature by two orders of magnitude. Furthermore, it is shown that a flux of potential enthalpy can be called “the heat flux even though potential enthalpy is undefined up to a linear function of salinity. The exchange of heat across the sea surface is identically the flux of potential enthalpy. This same flux is not proportional to the flux of potential temperature because of variations in heat capacity of up to 5%. The geothermal heat flux across the ocean floor is also approximately the flux of potential enthalpy with an error of no more that 0.15%. These results prove that potential enthalpy is the quantity whose advection and diffusion is equivalent to advection and diffusion of “heat” in the ocean. That is, it is proven that to very high accuracy, the first law of thermodynamics in the ocean is the conservation equation of potential enthalpy. It is shown that potential enthalpy is to be preferred over the Bernoulli function. A new temperature variable called “conservative temperature” is advanced that is simply proportional to potential enthalpy. It is shown that present ocean models contain typical errors of 0.1°C and maximum errors of 1.4°C in their temperature because of the neglect of the nonconservative production of potential temperature ... and potential temperature, rests on an incorrect theoretical foundation ..."
(Potential Enthalpy: A Conservative Oceanic Variable for Evaluating Heat Content and Heat Fluxes, emphasis added). The removal of potential temperature and replacing it with Conservative Temperature in ocean models will remove errors.

Fig. 3a CT
Fig. 3b hO
Today's graphs confirm Dr. McDougall's statement that Conservative Temperature (CT) is proportional to Potential Enthalpy (hO) at all pelagic depths (see the link at Fig. 1 for more about pelagic depths).

The graphs at Fig. 2a - Fig. 2e show that the "pattern" of CT, hO, and changes in hO, are identical patterns to one another at all depths.

By pattern I mean that there is a distinct proportionality to those three graph lines even though the value of CT is degrees C, and the values of Potential Enthalpy and change in Potential Enthalpy are shown in Joules per kilogram.

The proportionality pattern indicates that Conservative Temperature is better related to heat content and heat flux than the former potential temperature was.

The graphs at Fig. 3a and Fig. 3b show the same pattern proportionality in a different graph format.

You may have noticed that Absolute Salinity (SA) does not have the same pattern, nor should it.

According to some modelers ocean models are slow to adapt the new standard that was officially released in 2010 (some eight years ago).

One wonders if Humble Oil-Qaeda has once again had something to do with that.

The next post in this series is here.

What's puzzling you ...


Don't despair ... learn ...