|
| Fig. 1 Mysterious Planet |
 |
| Fig. 2 Amundsen Sea |
 |
| Fig. 3 Weddell Sea |
 |
| Fig. 4 W. Pacific |
 |
| Fig. 5 Amundsen Sea |
 |
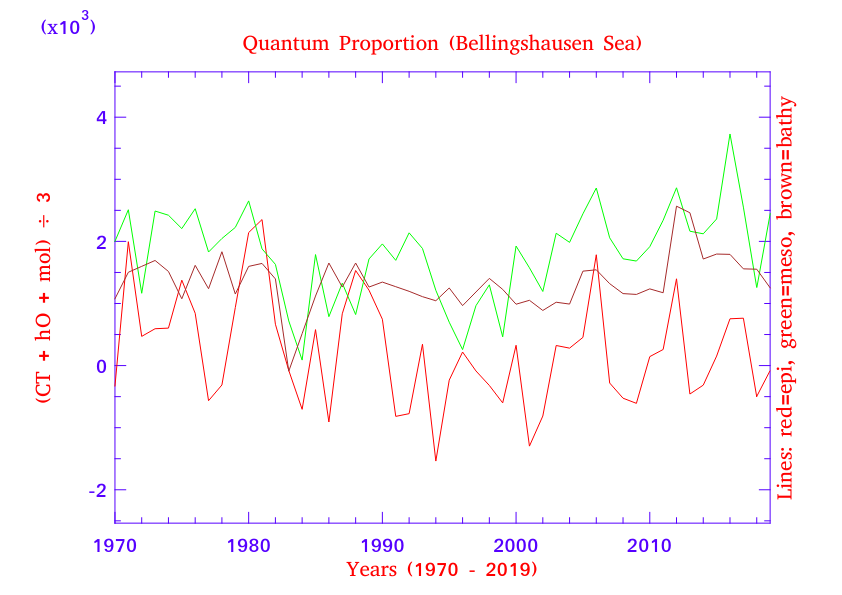
| Fig. 6 Bellingshausen Sea |
 |
| Fig. 7 Indian Ocean |
 |
| Fig. 8 Ross Sea |
I. Xploring
Let's explore the places too many men and women have not gone to.
Let's peer into the Midnight Zone because that is a term that applies to much of the areas that scientists have neglected to ponder.
We know more about the surface of the moon and Mars than we do of the oceans of the Earth (The World According To Measurements - 24).
There was "no reason to explore" a solidly frozen waste land that meant nothing to us:
"For decades, researchers considered this portion of the continent to be stable. While warming sea and air temperatures have caused ice shelves and glaciers in the lower-altitude, warmer western regions of the Antarctic to melt and collapse, the larger, colder East had seemed an untouchable behemoth. If anything, climate change was expected to bring more snow to its interior, making its ice sheets grow in size."(Polar Warning: Even Antarctica’s Coldest Region Is Starting to Melt).
II. Tireless Photons
While the researchers were sleeping in the midnight zone, the tiniest of quanta were plumbing those midnight zone depths and producing plumes (The Ghost Photons, 2, 3; The Ghost Plumes, 2, 3, 4, 5, 6, 7, 8, 9).
Their tininess as individuals (quantum) blinded the research community managers to their largess as a group (quanta) while the ice melted away in the "stable" melt-free midnight zone (Antarctica loses three trillion tonnes of ice in 25 years; Climate change: Greenland ice melt 'is accelerating').
Since the "ice was stable and not melting" the suspect in the detective research world was the thermals that puffed up the ocean like yeast.
All that did not go unnoticed here at Dredd Blog (On Thermal Expansion & Thermal Contraction, 2, 3, 4, 5, 6, 7, 8, 9, 10, 11, 12, 13, 14, 15, 16, 17, 18, 19, 20, 21, 22, 23, 24, 25, 26, 27, 28, 29, 30, 31, 32, 33, 34, 35, 36, 37, 38, 39, 40, 41, 42).
III. Boring!
When the woke crew bored and stroked their equipment down to where
"A team of scientists has observed, for the first time, the presence of warm water at a vital point underneath a glacier in Antarctica--an alarming discovery that points to the cause behind the gradual melting of this ice shelf while also raising concerns about sea-level rise around the globe.(Antarctica Thwaites, emphasis added; cf. ITGC Thwaites). It could also be called the "Totten effect" (Hot, Warm, & Cold Thermal Facts: Tidewater-Glaciers - 2).
Warm waters in this part of the world, as remote as they may seem, should serve as a warning to all of us about the potential dire changes to the planet brought about by climate change," explains David Holland, director of New York University's Environmental Fluid Dynamics Laboratory and NYU Abu Dhabi's Center for Global Sea Level Change, which conducted the research. "If these waters are causing glacier melt in Antarctica, resulting changes in sea level would be felt in more inhabited parts of the world.
The recorded warm waters--more than two degrees above freezing--flow beneath the Thwaites Glacier, which is part of the Western Antarctic Ice Sheet. The discovery was made at the glacier's grounding zone--the place at which the ice transitions between resting fully on bedrock and floating on the ocean as an ice shelf and which is key to the overall rate of retreat of a glacier."
IV. Exciting!
Rejecting past scientific madness to embrace exciting new truth is a common denominator in science, or at least it should be (Want to do better science? Admit you’re not objective).
So, today (unlike in a recent post: Quantum Oceanography - 2) I am not including "Thermal Expansion & Contraction" graphs, but I did link to the "On Thermal Expansion and Contraction" series in Section II above.
Today's graphs feature areas around the coastline of the continent of Antarctica.
Today's Appendix contains graphs that focus on the energy in the seawater molecules that are melting the Antarctic Tidewater Glaciers all around that continent, and have been doing so for decades.
The water temperature down in the "midnight zone" where research lights have tended not to go has been "warm" enough to melt tidewater glaciers for decades.
And it has been melting them all along the yellow brick road years, thanks to Oil-Qaeda (Humble Oil-Qaeda, 2).
V. Closing Comments
The graphs in The Appendix do not contain all depths and all years of data.
That is because I have not completely mastered the new graphing techniques I have recently written about.
But the graphs do show that there is enough energy, and it is increasing, to continue to accelerate the melt taking place in Antarctica.
The Appendix contains a comparison of the Conservative Temperatures around Antarctica compared to the temperature boundary where on the warm side of that boundary ice melts, but on the cold side of that boundary seawater freezes.
As the scientist in one of the papers linked to above put it: "The last time we looked at the polar ice sheets, Greenland was the dominant contributor. That's no longer the case" ("Antarctica loses three trillion tonnes of ice in 25 years", emphasis added).
The next post in this series is here, the previous post in this series is here.
Academy of Sciences member Dr. Eric Rignot: