 |
| Fig. 1a |
Thermal expansion of pure water does not have the same thermodynamic events that the thermal expansion of sea water has.
Nevertheless, you can search the Internet and find videos of someone pouring pure water into a flask, making a mark on the flask, then heating the flask with a Bunsen Burner.
Then, after the water warms, they will put another mark on the flask
ostensibly showing that the heat has caused the water to increase in volume.
Then they are apt to declare that this proves that thermal expansion is
the major cause of sea level rise because "as water warms it expands."
The problem with this
Mickey Mouse trick is that the pure water they use is at a temperature that is not below its
maximum density temperature of 4 deg. C when they apply heat to the flask.
If it was, the
pure water would contract (lose volume)
rather than expand (gain volume) until the
pure water temperature reached the
maximum density temperature of 4 deg C.
From
that temperature on, it would begin to expand as more heat is applied (see
Fig. 1a).
 |
| Fig. 1b |
For example, if the pure water temperature is 2 degrees C and heat is applied, the water will contract (lose volume) until its temperature increases to the maximum density temperature of 4 deg C, at which point it will expand (gain volume) if more heat is added.
Determining the
maximum density of sea water is more difficult than with pure water, because sea water contains other substances, and also is impacted by depth pressure (
Is A New Age Of Pressure Upon Us? - 14).
 |
| Fig. 1c |
The graphs at
Fig. 1b and
Fig. 1c show a history of the sea water temperature in a
Hypotherical WOD Zone at 10-20 meters deep (see actual graphs
here).
Following the principles depicted in
Fig. 1a, I have marked the expansion
and contraction events to show the almost unbelievable
expanding and contracting actions as the
sea water temperature (black line) dips below or rises above the
maximum density temperature (maximum density temperature is shown by the red line).
The gist of it is that when the
sea water temperature (black line) is above the
maximum density temperature (red line) the
volume change is the opposite of what it is when the sea water temperature (black line) is below the
maximum density temperature (red line).
The non-marked-up version of the
Fig. 1b graph is shown at
Fig. 1c.
Today, I used
only one zone, specifically for emphasizing that
the net balance derived by adding up the thermal expansion (pluses), and subtracting the thermal contractions (minuses) does not result in either "
the major factor" or "
a major factor" of sea level rise.
The graph at
Fig. 1c, as well as the following graphs, were computed by using the
TEOS-10 function
gsw_ct_maxdensity to create the red line, and
gsw_ct_from_t to generate the black line (see
On Thermal Expansion & Thermal Contraction - 35).
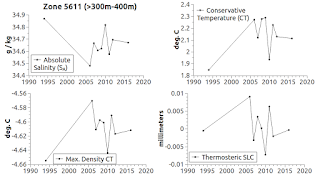
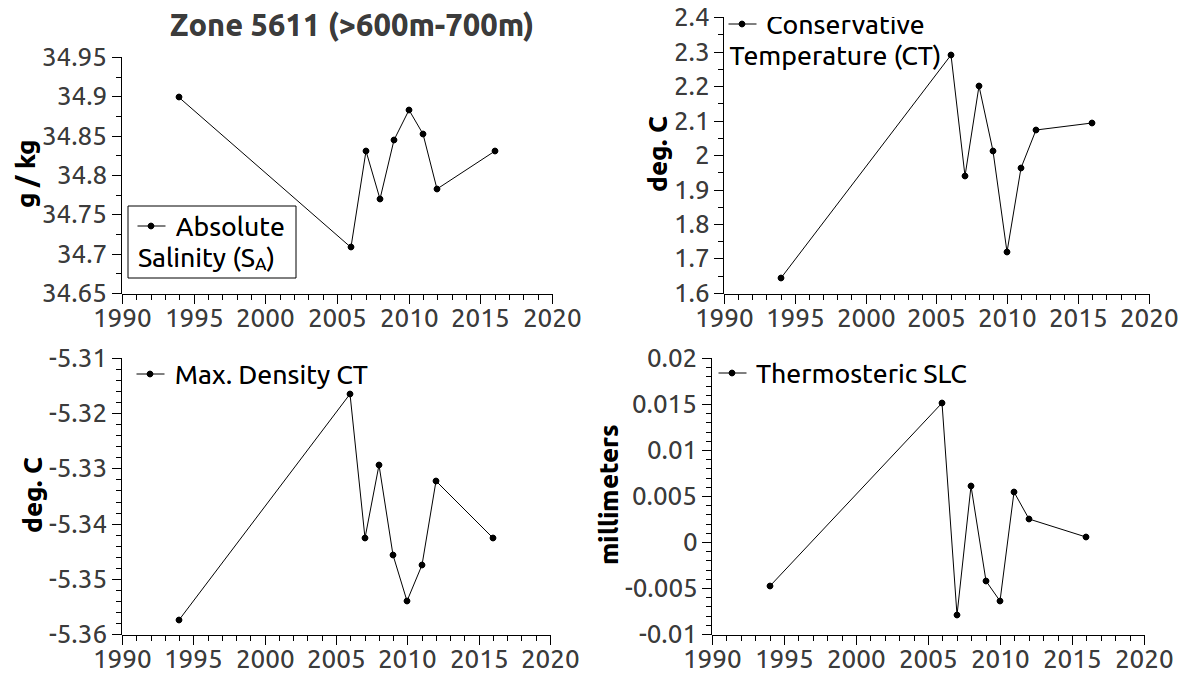
Each of the following graphs (
Fig. 2a -
Fig. 2r) was generated using data from a different depth, but they are all constructed from
WOD data collected in
WOD Zone 5611.
TEST: see if you can determine
expansion and contraction segments of the black line as I did in
Fig. 1b. [Remember to
follow the time line flow (left to right):
Answers]
Remember that (in terms of whether
expansion or contraction will take place) when the black line is above the red line, sea water thermodynamics are the opposite from when the black line is below the red line (cf
On Thermal Expansion & Thermal Contraction - 35).
This is why we need this focus:
"The vast Southern Ocean, which surrounds Antarctica, plays a starring role in the future of climate change. The global oceans together absorb over 90 percent of the excess heat in the climate system and roughly three-quarters of that heat uptake occurs in the Southern Ocean. In addition, the global oceans absorb around 25 percent of anthropogenic carbon dioxide emissions and the Southern Ocean alone accounts for about half of the uptake of CO2.
Despite its critical role in our climate system, the Southern Ocean has gone almost completely unobserved. Scientists have struggled to gather precise measurements because of the harsh environment and extreme remoteness. The changing dynamics of the Southern Ocean will in turn drive key aspects of our future climate, including how sensitive the Earth will be to further warming and increases in carbon dioxide emissions. As a result, improved observations are crucial to helping scientists understand and predict how our climate will change."
(
Antarctica 2.0 - 3, quoting
Climate Central). When the sea level is rising and the
net result of thermal expansion / contraction totals is a minor player, a small number, then
melting tidewater glaciers and other melting ice in the Cryosphere quite obviously must be
the major player.
Finally, yes the lines on the graphs are somewhat jerky because that area of the world makes it difficult to take measurements.
There are not as many measurements over the decades as we would like (especially at deepest depths), but there are enough to give us a heads up.
The next post in this series is
here, the previous post in this series is
here.
 |
| Fig. 2a |
 |
| Fig. 2b |
 |
| Fig. 2c |
 |
| Fig. 2d |
 |
| Fig. 2e |
 |
| Fig. 2f |
 |
| Fig. 2g |
 |
| Fig. 2h |
 |
| Fig. 2i |
 |
| Fig. 2j |
 |
| Fig. 2k |
 |
| Fig. 2l |
 |
| Fig. 2m |
 |
| Fig. 2n |
 |
| Fig. 2o |
 |
| Fig. 2p |
 |
| Fig. 2q |
 |
| Fig. 2r |


Scrubbler suffers from the "Mercer effect" pointed out by James Hansen (link).
ReplyDelete