 |
| Fig. 1a Antarctica Tidewater Glaciers |
 |
| Fig. 1b WOD areas "A" through "F" |
The paper I am in reference to is a paper that discusses Antarctic Tidewater Glaciers in terms of their velocity, location, and melt conditions (Recent high-resolution Antarctic ice velocity maps reveal increased mass loss in Wilkes Land, East Antarctica).
 |
| Fig. 2a |
 |
| Fig. 2b |
 |
| Fig. 3a |
 |
| Fig. 3b |
Those names and the boundaries of those areas, as well as the bounds of the Southern ocean itself, have changed over time (see e.g. this map and this map).
Anyway, the scientists who presented the paper also labeled those areas "A" through "F" in terms of the land areas of Antarctica that the areas were also associated with (Fig. 1a).
In order to identify them in terms of WOD Zone locations, I marked them as "A" through "F" on the WOD Zone map (Fig. 1b).
 |
| Fig. 4a |
 |
| Fig. 4b |
 |
| Fig. 5a |
 |
| Fig. 5b |
The graphs have the name of the area they are associated with at the top of each graph, but in these graphs the zones are not listed.
The WOD Zones (in parentheses) associated with each Southern Ocean subdivision are as follows:
West Indian Ocean, area "A" (3600, 3601, 3602, 3603, 3604, 3605, 3606, 3700, 3701, 3702);
East Indian Ocean, area "B" (3607, 3608, 3609, 3610, 3611, 3612, 3613, 3614, 3615);
Ross Sea, area "C" (3616, 3617, 3716, 3717, 5615, 5616, 5617, 5715, 5716, 5717);
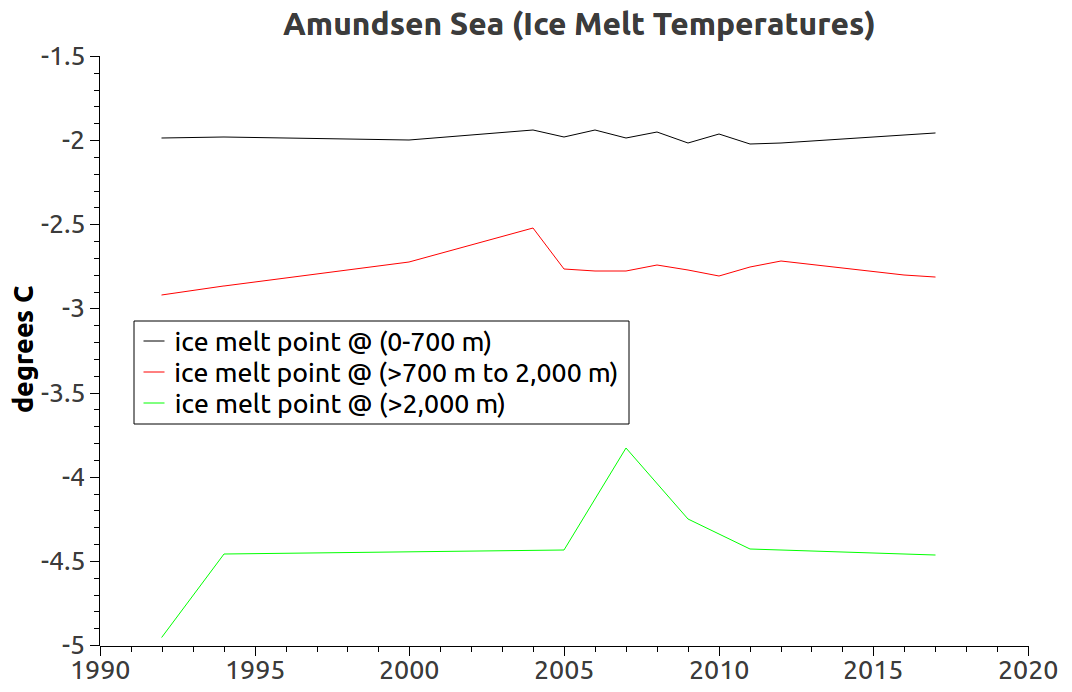
Amundsen Sea, area "D" (5611, 5612, 5613, 5614, 5711, 5712, 5713, 5714);
Bellingshausen Sea, area "E" (5606, 5607, 5608, 5609, 5610, 5706, 5707, 5708, 5709, 5710);
and the Weddell Sea, area "F" (5600, 5601, 5602, 5603, 5604, 5605, 5700, 5701, 5702, 5703, 5704, 5705).
 |
| Fig. 6a |
 |
| Fig. 6b |
 |
| Fig. 7a |
 |
| Fig. 7b |
But more than that, the main purpose of this series is to dispel the "old Antarctica myth" which misinformed us that Antarctica (especially East Antarctica) was not melting but instead was gaining ice mass.
Basically, like tidewater glaciers everywhere, the ice sheet is melting at its "termini" in the form of what are called tidewater glaciers (Hot, Warm, & Cold Thermal Facts: Tidewater-Glaciers, 2, 3, 4).
But more than that, the glaciers are generally flowing, and sometimes accelerating, into those six areas of the Southern Ocean.
The bottom line is that calving of ice bergs is caused by the flow of the ice streams, while melting is caused by the temperature of the tide water the glaciers come in contact with.
That issue has been discussed in another Dredd Blog series in terms of the very cold water that is melting the even colder glacial ice (Hot, Warm, & Cold Thermal Facts: Tidewater-Glaciers, 2, 3, 4).
The TEOS-10 "Conservative Temperature" (CT) in the 'a' graphs is the mean average of all the zones in the particular area for those years.
The 'b' graphs display the melt point of the glacial ice when it comes in contact with the less-cold ocean water.
That is, the cold water at or above that temperature will melt the ice when contact is made.
All of the graphs display these values as representing three layers or levels of depth.
Those layers extend from the surface to the bottom of each area.
The depths of each layer are noted on the graphs.
These temperatures vary from area to area and depth to depth, as do even the in situ measurements (i.e. non-TEOS, non-Conservative-Temperatures, non-pair measurements used in the previous post
One thing I find interesting is that in Antarctica the deeper the water does not always mean it is the coldest water.
Sometimes the surface water is the coldest, but the temperatures at the three levels vary from that format from time to time.
The more critical understanding is that the frigid water melts the even colder ice.
Melt takes place at temperatures which would give us hypothermia and death if we were submerged in it for very long (the myth that only "bathtub-warm" water can melt the great glaciers has led many astray).
It has also caused researchers to miss the fact that the great ice sheets began to melt as early as a couple of decades after the Industrial Revolution began (The Warming Science Commentariat - 3; Proof of Concept , 2, 3, 4, 5, 6, 7, 8).
The next post in this series is here, the previous post in this series is here.
No comments:
Post a Comment