 |
| Fig. 1 WOD Layers |
I. Background
I have now placed the relevant data into my SQL server and am now excited to get back to work.
Improvements are welcome at Dredd Blog (e.g. world class TEOS-10).
Regular readers know that the World Ocean Database (WOD) folks recently updated their data: "The WOA18 prerelease - September 30, 2018 updates previous versions of the World Ocean Atlas to include approximately 3 million new oceanographic casts added to the World Ocean Database and renewed quality control."
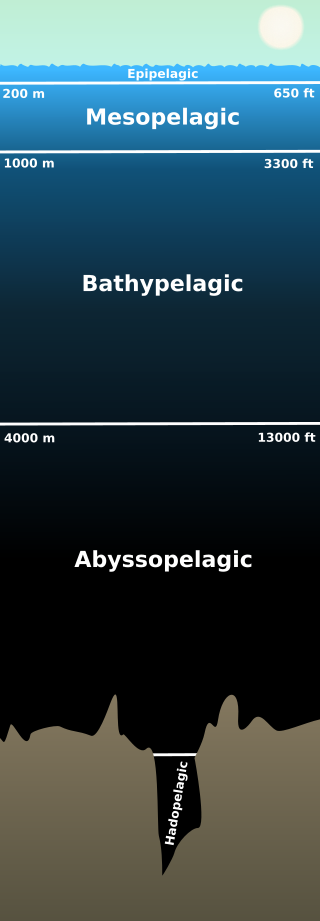 |
| Fig. 2 Pelagic depths |
II. More Casts
Notice that the September 30, 2018 update involves not only improved quality control, it also includes substantially more data (about 3 million more "casts").
Regular readers will remember that I recently described what a "cast" is, and that millions of in situ measurements can be fit into a single cast (The World According To Measurements - 22).
III. After The Download
I downloaded all of the WOD-18 regular data in year by year format, converted it from WOD format into CSV format, and then loaded it into my SQL server.
I indicated that once that had been done, I would compare the WOD-13 to the ostensibly new and improved WOD-18 ("I plan to do some upcoming posts comparing the September update with the legacy data" - An Updated World Ocean Database).
 |
| Fig. 3a |
 |
| Fig. 3b |
 |
| Fig. 3c |
 |
| Fig. 3d |
 |
| Fig. 3e |
IV. Let The Comparisons Begin
I decided that the easiest way to for readers to compare the two versions would be to do the same graphs as in the first post of this series (In Search Of Ocean Heat).
Not only that, I have numbered the graphics and the graphs in today's post with the same values that they had in the first post (so that they can be more easily compared one to the other).
V. Where The Heat Is
What is most important to remember is that in the search of "heat" in the waters of the oceans, it is appropriate to know how to measure it as it spontaneously flows from warmer waters to cooler waters.
World class scientists convinced me that "potential enthalpy" is the better or best way to conceive of ocean "heat" ("it is perfectly valid to talk of potential enthalpy, h0, as the 'heat content'" - Potential Enthalpy: A Conservative Oceanic Variable for Evaluating Heat Content and Heat Fluxes, McDougal 2003, pp. 945-46, emphasis added).
Another very important thing to keep in mind is that as the ice sheets at the poles melt and calve, and as that cold melt water and those icebergs enter the oceans, they change the temperature of the water.
So, currently the oceans are being warmed by the increasing amount of heat that would radiate into deep space if it were not for greenhouse gases caused by civilization's massive burning of fossil fuels; and currently the oceans are also being cooled at some places by cold melt water.
That is why the graphs of the heat at the poles show more volatility and oddity than those at mid latitudes do.
The warmer waters flowing into the polar regions mix with the cooler waters flowing out from from the melting ice sheets (Greenland 2.0 - 2, Mysterious Zones of Antarctica - 3).
Thermodynamically, the cold and warmer water temperatures tend toward equilibrium, but until that happens there is some non-intuitive volatility indicated by the graph lines.
VI. The Layers
 |
| Fig. 4 |
"Layers" in this context are latitude bands that are parallel to the equator, reaching from the equator all the way up to the north pole, and reaching all the way down to the south pole (Fig. 1).
Layer 0 is in the Arctic region, Layer 16 is in the Antarctic region, and Layer 8 is in the equatorial region.
VII. Conclusion
The reason we can even take on a software search for ocean heat is largely due to the functionality of TEOS-10.
We are indebted to scientist Josiah Willard Gibbs, who "wrote the book" on seawater thermodynamics (The World According To Measurements - 12).
In the days ahead we will continue to watch the ocean because it will have a huge impact on current civilization (Greenland & Antarctica Invade The United States, 2, 3, 4; Why Sea Level Rise May Be The Greatest Threat To Civilization, 2, 3, 4, 5).
The next post in this series is here, the previous post in this series is here.
"Neil Young Angry About Dylan Show Announcement, Will Fight Sponsor Barclays For Funding Fossil Fuels" - (link)
ReplyDeleteI updated the graphs (layer 4, 8, 12, 16) adding the abyssopelagic graph lines that had been left out.
ReplyDelete