 |
| Fig. 1 WOD layers |
There is nothing ipso facto wrong with an unorthodox effort to estimate the quantity of heat or heat uptake in the oceans or to criticize traditional ways of doing it (On Resplandy Et Alia (2018)).
I was impressed with their admission to a serious mistake in their paper that was discovered by another researcher who was not involved in their research (Beware of Double Downers).
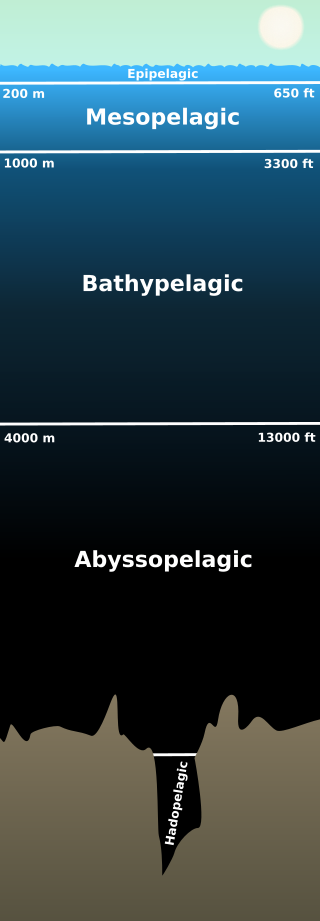 |
| Fig. 2 Pelagic depths |
At the same time I criticized their characterization of the current sources, and/or the lack thereof, for in situ ocean measurements (ibid).
To support my criticism I listed what publishers of journals tend to consider official sources for that very information, and more (id.).
To cement the criticism, I pointed out that scientific journals are beginning to require that those who submit papers to them must indicate the specific sources where they acquired the datasets used in submitted papers (id.).
Such requirements facilitate one of the more important elements of the dynamics of scientific papers, which is the ability to verify or falsify the essential elements of hypotheses set forth in scientific papers.
Only valid papers are composed of one or more hypotheses that can be falsified or verified.
The Resplandy et al. (2018) paper criticized ARGO float data using generalities without adequate specifics, and it failed to list any bona fide alternate sources of datasets.
In effect they rejected the plethora of worthy sources for in situ data going back hundreds of years.
 |
| Fig. 3a Layer 0 |
 |
| Fig. 3b Layer 4 |
 |
| Fig. 3c Layer 8 |
 |
| Fig. 3d Layer 12 |
 |
| Fig. 3e Layer 16 |
Our science, economics, engineering, and our "world", are based on measurements, so they ideologically avoided a lot of measurements (The World According To Measurements, 2, 3, 4, 5, 6, 7, 8, 9, 10, 11, 12, 13, 14, 15, 16, 17, 18, 19, 20, 21).
But alas they favored a plethora of other measurements without explaining sufficiently, IMO, why measurement set "X" is better than measurement set "Y."
Their extrapolation was based on random sources of atmospheric measurements, evidently under the assumption that atmospheric measurements are a better indication of how much heat is in the ocean than actual measurements of the heat in the ocean are.
The heat in the ocean is always trying to hide it would seem ("its here, its there, its everywhere").
Which brings up, among other things, "heat."
I have recently written about "enthalpy," which, in the context of TEOS-10 is heat related (On Thermal Expansion & Thermal Contraction - 39, Hot, Warm, & Cold Thermal Facts: Tidewater-Glaciers - 7, In Pursuit of Plume Theory).
The TEOS-10 documentation indicates that enthalpy is important in terms of ocean heat content (cf. Potential Enthalpy: A Conservative Oceanic Variable for Evaluating Heat Content and Heat Fluxes, McDougal 2003; and TEOS-10 gsw_CT_from_pt).
So, today's graphs (Fig. 3a - Fig. 3e) show the results of the TEOS-10 function gsw_enthalpy_t_exact at locations marked on Fig. 1 (blue squares), and depths shown on Fig. 2.
The point of the graphs and this post is that the heat distribution in the ocean is anything but uniform.
In that regard (non-uniformity), it is like sea level change (The Gravity of Sea Level Change, 2, 3, 4; NASA Busts The Ghost; The Ghost-Water Constant, 2, 3, 4, 5, 6, 7, 8, 9).
The enthalpy in one "place" can be very different than enthalpy at another "place" (both "places" being seawater at equal depths but at a different latitude and longitude).
In a subsequent post I will focus on "potential enthalpy" to enhance this series.
The previous post in this series is here.
"He say one and one and one is three ..."
No comments:
Post a Comment