 |
| Fig. 1a |
 |
| Fig. 1b |
 |
| Fig. 1c |
All that is required to melt tidewater glaciers is seawater that is less cold than those tidewater glaciers.
The speed of melt is what is impacted by the temperature difference between the subsurface glacier ice and the seawater in contact with it.
Generally, a one degree difference will cause a slower melt than a three degree difference.
But there are exceptions, such as amount of salinity or refreshing currents which bring in new seawater with more potency.
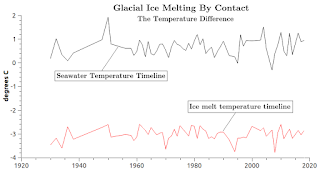
The importance of that can be discerned by graphics at Fig. 1a - Fig. 1c.
The story begins with a time line which depicts years of temperature variation between the seawater temperature and the temperature of the glacial ice in contact with the seawater (Fig. 1a).
Next is the contact with the ice face of the tidewater glacier (Fig. 1b).
That contact leads to the scenario in Fig. 1c, where a new entity, melt water (the green color between the cyan color and the blue color), appears on the scene.
The basic dynamic at work that causes the melting is a matter of energy transfer described by the Second Law of Thermodynamics:
Now that we have been brave enough to admit the existence of thermal contraction, we can consider the Second Law of Thermodynamics.(On Thermal Expansion & Thermal Contraction - 26). The energy in the form of heat in the cold (but warmer than ice) water contacting the glacial ice flows spontaneously into the colder ice mass.
I mean that we can do so at least in the sense of the movement of heat in the oceans (which has one and only one direction) which is from warm to cold (NASA, Univ. of Winnipeg).
When enough energy has entered into the ice mass it causes the ice to exceed the temperature of ice, so it changes in structure to become melt water.
That melt water has more heat energy in it than the ice it came from had, but it has less heat energy than the warmer seawater had that originally contacted the ice.
That by itself (melt water is cooler than the seawater that caused it) would slow down the process if all things remained that way.
A perpetual melt water buffer would slow down the melt rate.
That is, because the melt water has less heat energy than the original water that made contact with the ice, the speed of the melting would slow down a bit.
But, the thing about Antarctica is that it's tide waters in contact with tidewater glaciers is substantial and is refreshed regularly:
"The vast Southern Ocean, which surrounds Antarctica, plays a starring role in the future of climate change. The global oceans together absorb over 90 percent of the excess heat in the climate system and roughly three-quarters of that heat uptake occurs in the Southern Ocean. In addition, the global oceans absorb around 25 percent of anthropogenic carbon dioxide emissions and the Southern Ocean alone accounts for about half of the uptake of CO2.(Antarctica 2.0 - 6). Antarctica has the world's greatest current in the sense that more water flows within that current that in all the rivers on Earth combined:
Despite its critical role in our climate system, the Southern Ocean has gone almost completely unobserved. Scientists have struggled to gather precise measurements because of the harsh environment and extreme remoteness. The changing dynamics of the Southern Ocean will in turn drive key aspects of our future climate, including how sensitive the Earth will be to further warming and increases in carbon dioxide emissions. As a result, improved observations are crucial to helping scientists understand and predict how our climate will change."
"The Antarctic Circumpolar Current moves 140 million cubic meters (4.9 billion cubic feet) of water per second around Antarctica. That single current moves more water than all the rivers on the planet combined. The world's rivers move 1.3 million cubic meters (46 million cubic feet) of water per second."(Mysterious Zones of Antarctica - 2). Thus, the melt is not slowing down there, no, it is accelerating because the water in contact with tidewater glaciers is refreshed by a major current (which removes cooler melt water).
I have prepared graphs (like the symbolic one at Fig. 1a) for all of the areas of Antarctica where the melting described in today's post is taking place.
They are not merely symbolic graphs, they detail the actual melt conditions for areas all around Antarctica (like those I did to detail Antarctica glaciers; see Antarctica 2.0 - 6 and attachments A, B, C, D, E, F).
These new graphs, calculated using the TEOS-10 library, also feature the new oceanographic depth levels I have begun to use (New Slang).
Here are the links to appendices containing those graphs A, B, C, D, E, F.
The next post in this series is here, the previous post in this series is here.
No comments:
Post a Comment