 |
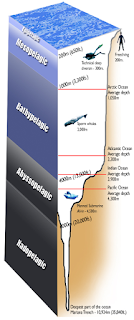
| Fig. 1 Pelagic Depths |
In today's post I want to review the reasons for the change, while showing how the "new parts" synchronize with the new whole.
By "review" I only mean that I will quote Dr. Trevor J. McDougall's paper in a slightly different way in order to focus on the errors in the old standard that were eradicated from the new standard for thermodynamics in oceanography.
I want to focus on the pattern of synchronization between Conservative Temperature and Potential Enthalpy.
As we will see, another valid way of saying that is "the pattern of synchronization between Conservative Temperature and Heat Flux" in seawater, because the old standard "Potential Temperature" was replaced with the new standard "Conservative Temperature" for reasons pointed out in the following quote:
 |
| Fig. 2a Epipelagic |
 |
| Fig. 2b Mesopelagic |
 |
| Fig. 2c Bathypelagic |
 |
| Fig. 2d Abyssopelagic |
 |
| Fig. 2e Hadopelagic |
"Potential temperature is used in oceanography as though it is a conservative variable like salinity; however, turbulent mixing processes conserve enthalpy and usually destroy potential temperature. This negative production of potential temperature is similar in magnitude to the well-known production of entropy that always occurs during mixing processes. Here it is shown that potential enthalpy—the enthalpy that a water parcel would have if raised adiabatically and without exchange of salt to the sea surface—is more conservative than potential temperature by two orders of magnitude. Furthermore, it is shown that a flux of potential enthalpy can be called “the heat flux” even though potential enthalpy is undefined up to a linear function of salinity. The exchange of heat across the sea surface is identically the flux of potential enthalpy. This same flux is not proportional to the flux of potential temperature because of variations in heat capacity of up to 5%. The geothermal heat flux across the ocean floor is also approximately the flux of potential enthalpy with an error of no more that 0.15%. These results prove that potential enthalpy is the quantity whose advection and diffusion is equivalent to advection and diffusion of “heat” in the ocean. That is, it is proven that to very high accuracy, the first law of thermodynamics in the ocean is the conservation equation of potential enthalpy. It is shown that potential enthalpy is to be preferred over the Bernoulli function. A new temperature variable called “conservative temperature” is advanced that is simply proportional to potential enthalpy. It is shown that present ocean models contain typical errors of 0.1°C and maximum errors of 1.4°C in their temperature because of the neglect of the nonconservative production of potential temperature ... and potential temperature, rests on an incorrect theoretical foundation ..."(Potential Enthalpy: A Conservative Oceanic Variable for Evaluating Heat Content and Heat Fluxes, emphasis added). The removal of potential temperature and replacing it with Conservative Temperature in ocean models will remove errors.
 |
| Fig. 3a CT |
 |
| Fig. 3b hO |
The graphs at Fig. 2a - Fig. 2e show that the "pattern" of CT, hO, and changes in hO, are identical patterns to one another at all depths.
By pattern I mean that there is a distinct proportionality to those three graph lines even though the value of CT is degrees C, and the values of Potential Enthalpy and change in Potential Enthalpy are shown in Joules per kilogram.
The proportionality pattern indicates that Conservative Temperature is better related to heat content and heat flux than the former potential temperature was.
The graphs at Fig. 3a and Fig. 3b show the same pattern proportionality in a different graph format.
You may have noticed that Absolute Salinity (SA) does not have the same pattern, nor should it.
According to some modelers ocean models are slow to adapt the new standard that was officially released in 2010 (some eight years ago).
One wonders if Humble Oil-Qaeda has once again had something to do with that.
The next post in this series is here.
What's puzzling you ...
Don't despair ... learn ...
No comments:
Post a Comment