 |
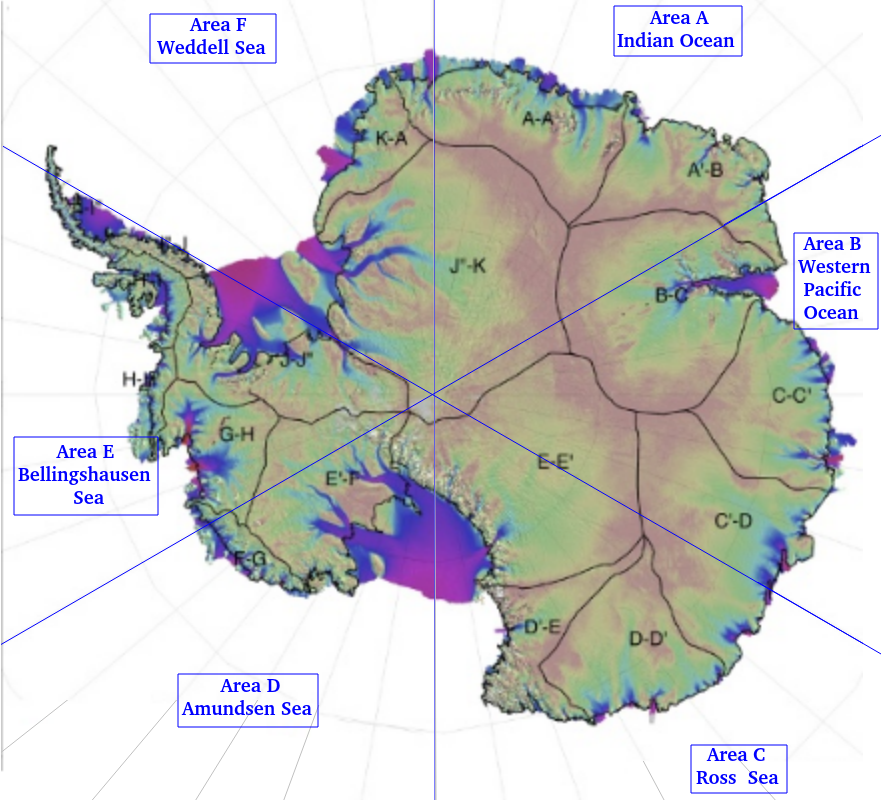
| Fig. 1 Areas/Sectors of Antarctica |
The graphs in today's post illustrate what has been repeated from time to time in this series (Antarctica 2.0, 2, 3, 4, 5, 6 [& supplements A, B, C, D, E, F], 7, 8, 9, 10, 11, 12).
To begin with, the Sahara desert receives more precipitation per square mile than Antarctica, the Earth's largest desert, does.
Many textbooks were written before those factors were known, so they set forth erroneous factors and figures.
Those errors in textbooks and published papers led to various myths about Antarctica, which are still being perpetuated by some in one sector of the media (The Warming Science Commentariat, 2, 3, 4, 5, 6, 7, 8, 9, 10, 11, 12, 13, 14, 15).
The whole picture (all Areas/Sectors) is depicted in the graphic at Fig. 1.
The individual areas/sectors (A,B,C,D,E,F) are graphed at Fig. 2 - Fig. 7 (Area/Sector D, Amundsen Sea, is not graphed due to a data download problem).
 |
| Fig. 2 All Antarctica |
The basic theme of all of the graphs presented today is to contrast the glacial "ice-melt temperature" (temperature at which the ice in contact with seawater will melt) and the ambient seawater temperature (seawater temperature at various depth levels where the seawater is in contact with the glacial ice).
There are three graph lines representing the temperature (TEOS-10 Conservative Temperature) at three depth levels (Epipelagic, Mesopelagic, and Bathypelagic).
The "take-home" information these graphs present is that the deeper seawater all around Antarctica, where tidewater glaciers flow into the ocean, is warmer than the ice it is in contact with or is close to (Quantum Oceanography, 2, 3, 4, 5, 6, 7, 8, 9, 10, 11, 12, 13, 14, 15, 16).
 | |
| Fig. 3 Area/Sector A |
 |
| Fig. 4 Area/Sector B |
The grounding lines of tidewater glaciers are not limited to West Antarctica, instead, the extent of tidewater glacier grounding lines reaches all around the perimeter of Antarctica along the coastline:
"This is a significant factor in terms of sea level change because the warmer waters, which are above (warmer than) the ice-melt temperature, are in contact with tens of thousands of kilometers (~58,000 km) of glacial ice."
(The Way of Civilizations - 2). We must remember that The Industrial Revolution of circa 1750 has been causing global warming, at an accelerating rate, all around the globe.
 |
| Fig. 5 Area/Sector C |
Eventually that "ocean heat" even reaches the deep waters surrounding Antarctica (In Search Of Ocean Heat, 2, 3, 4, 5, 6, 7, 8, 9, 10).
There it is hidden from The Warming Commentariat because that realm "majors in the minors" (and will likely continue to use "worse than previously thought", "surprise", and more) during seemingly endless placation episodes (which are even contaminating some scientists):
 |
| Fig. 6 Area/Sector E |
"Peter Neff, a glaciologist and assistant research professor at the University of Minnesota, said that to see even a small ice shelf collapse in East Antarctica was a surprise."
(Entire Conger ice shelf has collapsed in [East] Antarctica). A "small collapse" (in Fig. 1 Area/Sector B) is a major surprise within the realm of the denialists.
"Surprise" and "worse than previously thought" will continue to roll off the tongues, flow from the ink-pens, and click-bait out from the keyboards within the realm of our "criminal" denialists:
 |
| Fig. 7 Area/Sector F |
"Today's IPCC report is an atlas of human suffering and a damning indictment of failed climate leadership. With fact upon fact, this report reveals how people and the planet are getting clobbered by climate change. Nearly half of humanity is living in the danger zone – now. Many ecosystems are at the point of no return – now. Unchecked carbon pollution is forcing the world's most vulnerable on a frog march to destruction – now. The facts are undeniable. This abdication of leadership is criminal."
(How Microbes Communicate In The Tiniest Language - 3). Even the tiny microbes are better at warning their own species of pending danger than our Warming Commentariat.
In closing, remember that Conger Glacier is just down the trail from Totten Glacier, which I mentioned a few years back:
"I am talking about the main trail that leads to the plume of "the doomsday glacier" and its big brother the Totten Glacier."
(In Pursuit of Plume Theory). Totten is in a neighborhood that can supply a heavy dose of seaport problems (Hot, Warm, & Cold Thermal Facts: Tidewater-Glaciers - 2).
Totten Glacier (Conger Glacier's neighbor) itself can cause a catastrophe:
"Totten Glacier, East Antarctica, a glacier that holds a 3.9 m [12.8 ft] sea level change equivalent"
(Widespread Grounding Line Retreat of Totten Glacier, East Antarctica, Over the 21st Century).
The next post in this series is here, the previous post in this series is here.
The software library used to calculate the data in the appendices is available at no cost from the TEOS-10 website:
ReplyDeletehttps://www.teos-10.org/software/gsw_cpluspplus_v3_05_02.zip