This is an appendix to: The Ghost Plumes - 15
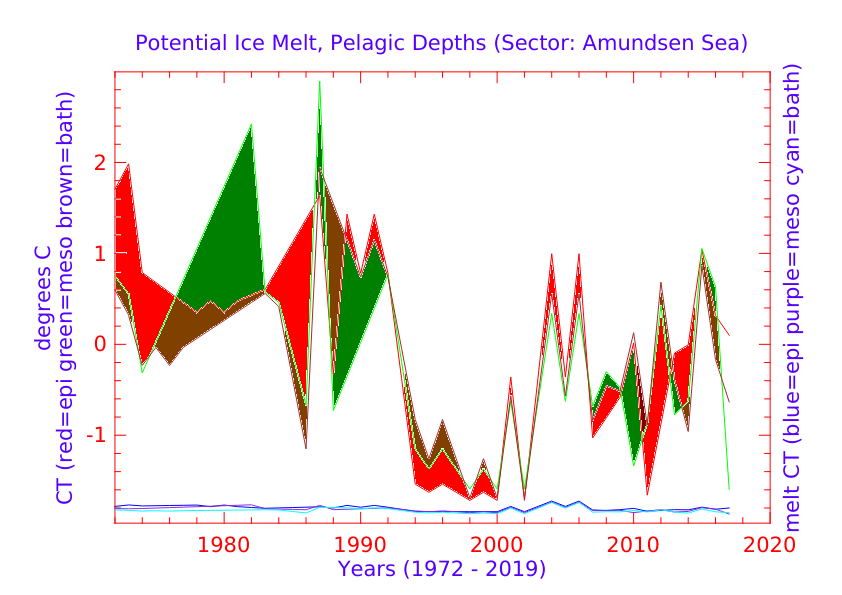
NOTE: The "CT melt" lines (bottom area of graphs) are not filled-in with colors. The "CT" colors (upper area of graphs) are selected by the line locations, in that, when a line representing a particular depth is either on top or on the bottom, that area is filled with that line color. The purpose for this technique is to show that the heat content at each depth level increases and decreases over time as "hot flows to cold, warm flows to cool" according to the laws of thermodynamics (see e.g Quantum Oceanography, 2, 3, 4).


No comments:
Post a Comment