 |
| Cherry Picking |
I. Background
In two recent Dredd Blog posts Proof of Concept - 9 and Let's Not Be Too Dense - 3, we looked at WOD Zones where the sea level rise or fall did not match the Conservative Temperature rise or fall.
Some might say they were cherry picked, which is true (à la "pick the cherries that are red"), however, cherry picking means selecting the cherries that are ripe for the picking.
For example, when the mission is to bring in only red cherries for examination, one brings in only red cherries or one is in error.
 |
| Fig. 1 Depth Layer 1 (0-700 meters) |
Likewise, when the mission is to bring in data only from areas where the sea level change trend and the temperature change trend is different, one is in error to bring in anything else.
Cherry picking is not ipso facto a bad thing, because when it is done correctly (don't pick the rotten ones when your mission is to pick edible ripe ones) it is a good thing.
II. Today's Cherry Picking
One mission today is to pick "cherries" (WOD Zones and PSMSL stations) only from the Southern Hemisphere.
 |
| Fig. 2 Depth Layer 2 (>700 - 2000 meters) |
What we are looking for is sea level change trend compared to Conservative Temperature change trend at three depth levels (0 to 700m Fig. 1), (greater than 700m to 2000m Fig. 2), and (greater than 2000 m Fig. 3).
 |
| Fig. 3 Depth Layer 3 (>2000 meters) |
Thus, today's graphs agree with the graphs in the two previous posts (Proof of Concept - 9 and Let's Not Be Too Dense - 3) because they show that thermal expansion is not "the" or even "a" major cause of the sea level change shown in today's graphs of the Southern Hemisphere.
III. More Graphs
 |
| Fig. 4 |
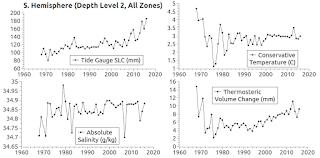
The added graphs (Fig. 4, Fig. 5, and Fig. 6) show the bottom line values of thermal expansion.
The locations are the N. Hemisphere (Fig. 4), the S. Hemisphere (Fig. 5), plus the combined values of both hemispheres (Fig. 6).
 |
| Fig. 5 |
The sea level change pane (upper left pane in each graph) begins in 1880 (unlike Fig. 1 - Fig. 3).
I did the change to the tide gauge pane to emphasize the fact that sea level rise caused by ice sheet and glacial melt began long before any thermal expansion took place (Humble Oil-Qaeda, 2).
 |
| Fig. 6 |
In the past few decades there has been measurable thermal expansion and contraction in sea water, however, regular readers know that Dredd Blog does not consider it to be a major factor in overall sea level changes (Hot, Warm, & Cold Thermal Facts: Tidewater-Glaciers, 2, 3, 4).
IV. Conclusion
In the surface to 700m depth layer (Fig. 1), and the >700m to 2000m depth layer (Fig. 2), the sea level is rising robustly (tide gauge records) while the Conservative Temperature is falling.
The TEOS-10 computations done in those two graphs therefore show that the thermosteric volume is decreasing (thermal contraction) in those cases.
The same is not true of depth layer 3 (>2000m) shown in the graph at Fig. 3, where there is some sea level change due to thermal expansion (~5 mm).
The supposition that thermal expansion is the main factor or a major factor in sea level change is not valid (On Thermal Expansion & Thermal Contraction, 2, 3, 4, 5, 6, 7, 8, 9, 10, 11, 12, 13, 14, 15, 16, 17, 18, 19, 20, 21, 22, 23, 24, 25, 26, 27, 28, 29, 30, 31, 32, 33, 34, 35, 36).
The oil industry has known all along that THE ICE SHEETS ARE MELTING (Humble Oil-Qaeda, 2; cf Merchants of Doubt) !
The previous post in this series is here.
I will immediately grab your rss feed as I can not find your e-mail subscription hyperlink or e-newsletter service.
ReplyDeleteDo you have any? Please permit me know in order that I may just subscribe.
Thanks.
v.gd
ReplyDeleteThere's definately a great deal to know about this issue.
I like all the points you have made.