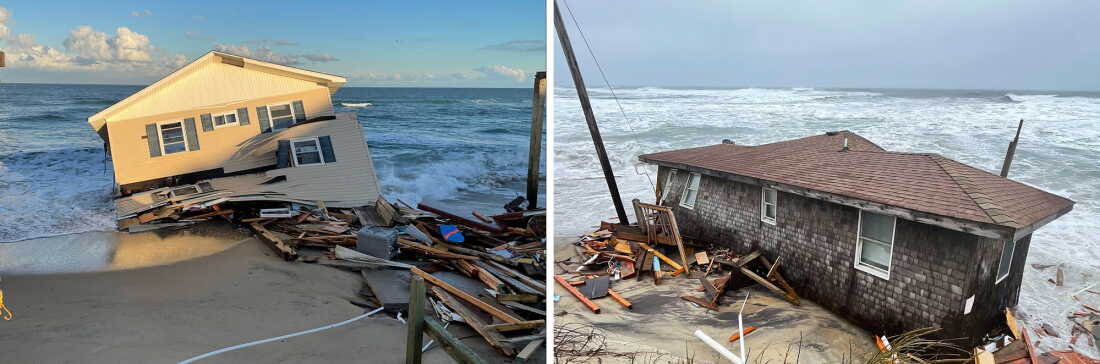
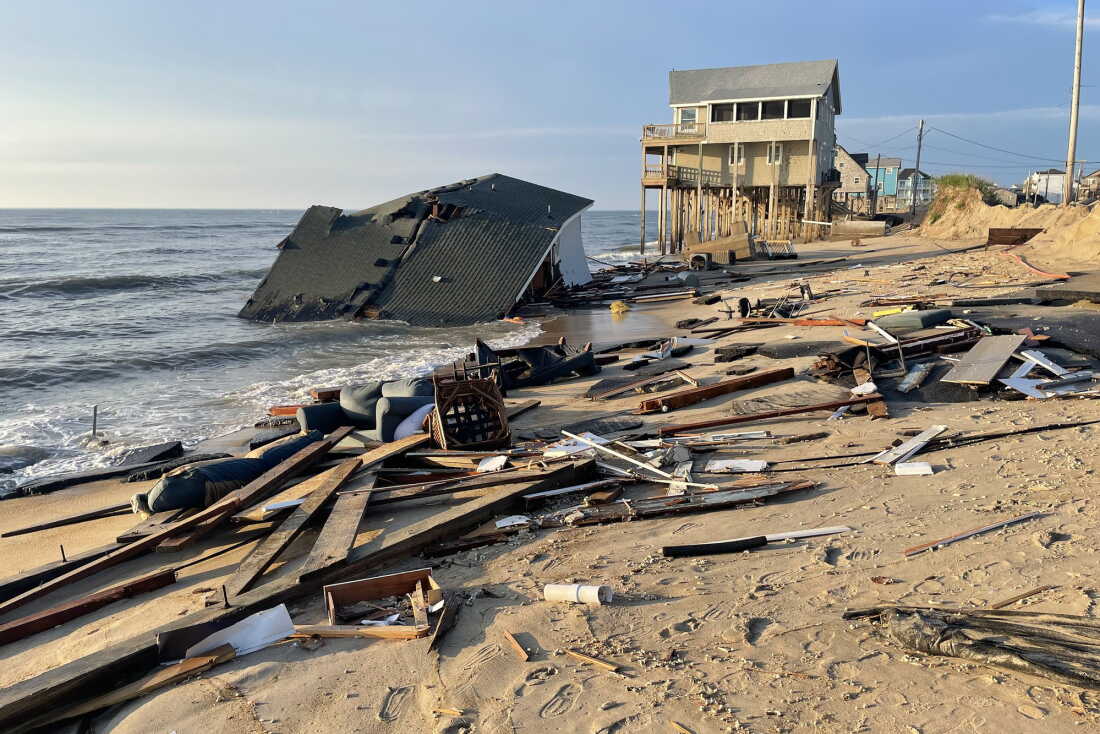
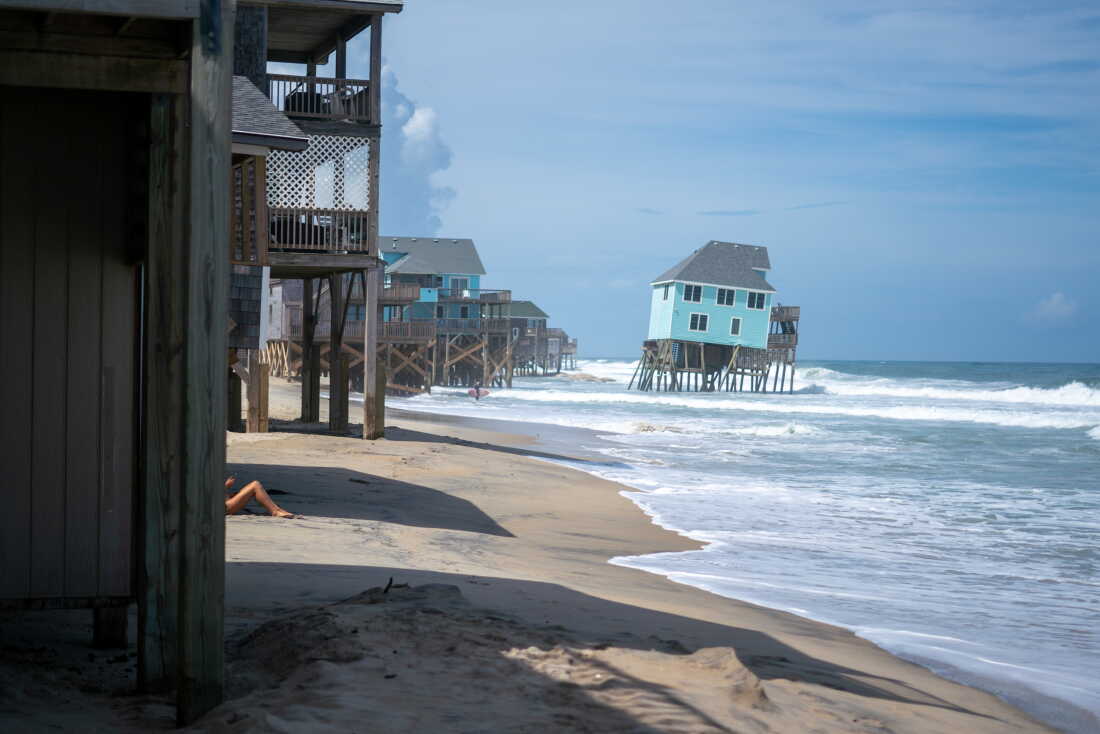
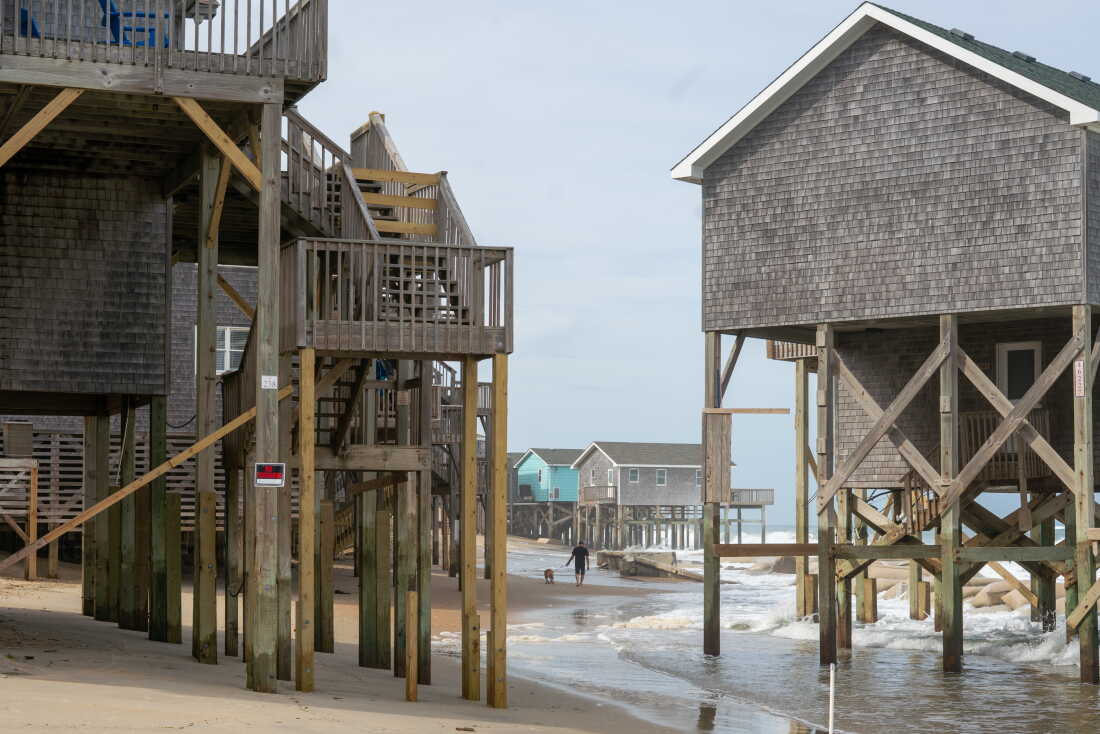
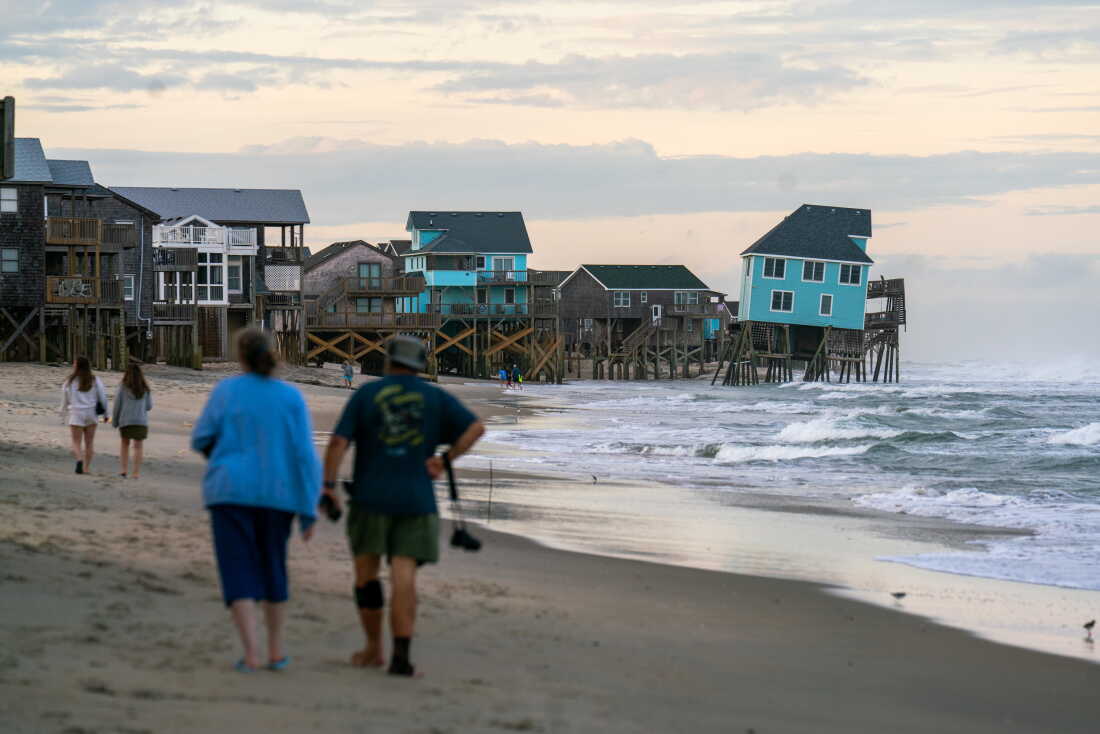
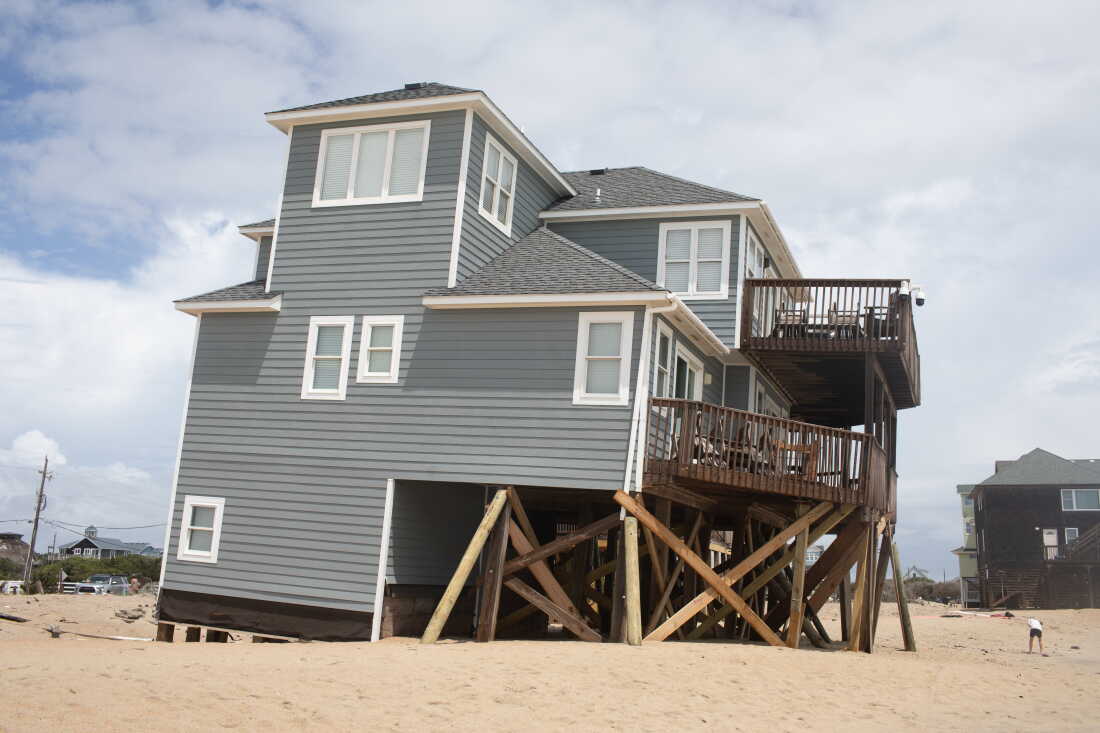
For hundreds or thousands or millions of years before Humble Oil-Qaeda began to use its energy to melt the ice sheets of the planet Earth, the monthly high tide marks were well below the place where beach homes came to be built (e.g. Fig. 2).
Yes, way before the year 2009 in Australia the full Moon would align with the Sun, but since it had no king designation there were no events called 'king tides'.
Fig. 2 Once upon a time
There were only high tides.
Then the king designation erupted from the minds of an Oil-Qaeda influenced Aussie or two, then spread like all trances do (Wikipedia).
Soon, some more astute scientific thinkers realized that a better designation would be "The Future Low Tide Mark", and they began a movement (King Tide Stuff).
The gist of it is the mantra "today's king tide mark is tomorrow's low tide mark", which indicated to them that coastal tide events could be a way of envisioning the future (Fig. 1).
This began an effort to record what the future would look like at coastlines around the globe:
"King Tides Project International is an initiative delivered by a network of organizers on coastlines around the world. We are citizen scientists, capturing data and images showing what the future sea levels will be and what is at risk.
The King Tides Project helps people all over the world understand how sea level rise will impact their lives."
We can see the efficacy of the averages of king tide dynamics in graphs that are also the averages of sea level dynamics (Tidal appendices: Countries, A-F, G-M, N-S, T-V).
The next post in this series is here, the previous post in this series is here.
The graphs for the following countries are composed from averaged RLR Data at Tide Gauge Stations in the named country. Some countries have both sea level fall and sea level rise (for example the USA has sea level fall in some areas of Alaska because they are within a certain distance from Glacier Bay, the Arctic Circle, and/or Greenland where there are large Ice Sheets.
The lines of both rise and fall are on the graphs to encompass the maximum and minimum high and low sea levels so the entire span is encompassed. The span of years is shown, the span of RLR is shown (in millimeters), and a total span is shown by (high RLR minus low RLR, divided by 304.8mm) in feet. The number of tide gauge stations graphed is also shown. The links to the tide gauge stations follow the station name (in parentheses).
A Journal of Coastal Research paper points out that because present day extreme high tide marks will become the normal high tide marks in cases of future sea-level change (reversed @sea level fall) these graphs document the annual averages of ebb and flow of both sea level change and king tide change.
The Moon and Sun are not changing the volume of sea water in the ocean by revolving around like a drunken soldier. Fossil fuel use is causing global warming like a drunken sailor burning down the house by "playing with fire" which melts the ice sheets around the globe which release water into the oceans.
It is interesting when scientific papers quote the obvious, such as the following in a paper about 'king tides':
"Because present day extreme high tides will be[come] the normal high tide levels [in cases of] future sea-level rise ..."
(The End of Year Data - 3, quoting Journal of Coastal Research paper). In other words, in Oceanography 101 language, that could be said as "today's high tide mark is going to become the low tide mark of the future to the extent that sea level rise takes place".
During that time, as now, homes are going to continue to fall into the ocean.
Fig. 2
"Over the last decade the concept of “king tides” has become a common colloquial term to describe higher than normal high tides. The terminology originated in 2009, when Australia experienced their highest seasonal tides in almost 20 years. In response, a public engagement program, “The King Tides Project,” was formed that has since spread globally. Discrepancies regarding the definition and frequency of king tides can be identified between the different initiatives. This communication analyzes the multifaceted and contradictory meanings of king tides and concludes by providing a holistic and comprehensive definition.
Fig. 3
We posit the increased use of the term “king tide” by various media outlets, including in the hit movie Justice League, results from the international efforts of The King Tides Project. The project started in Australia in 2009 after residents were impacted by the highest seasonal tides in almost 20 years. The King Tides Project has been very successful in Australia; they are actively recruiting other countries, states, and municipalities to participate. The project's goals are to educate the public and foster the creation of a catalog of hyperlocal flood risk data for researchers and decision makers. Because present day extreme high tides will be the normal high tide levels with future sea-level rise, the project encourages international communities to visualize this change using the tagline “snap the shore, see the future.”
Fig. 4
Australia, Canada, Mauritius, New Zealand, Tuvalu, and the United States participate in the King Tide Project. In the United States, the states with king tide initiatives are California, Connecticut, Florida, Georgia, Maine, Maryland, Massachusetts, New Hampshire, New Jersey, New York, North Carolina, Oregon, Rhode Island, South Carolina, and Washington. While the King Tides Project provides global communities with valuable information, the media popularization of the term “king tide” has caused confusion because of its inconsistent definitions. This short communication discusses existing definitions and offers a universally applicable definition.
Defining King Tides
Fig. 5
King tide is a colloquial term, leaving the project organizers to formulate their own definitions. Conceptually, a king tide is an exceptionally high and naturally occurring tide that causes nuisance flooding (also known as, “sunny day tidal flooding”). These events occur up to several times per month. The King Tides Project, however, defines these events according to the alignment of the Sun and Moon and states a “king tide” occurs twice per year.
Fig. 6
Fortunately, many king tides can be predicted, just as any other tidal event can be. Unfortunately, atmospheric disturbances can unexpectedly raise water to king tide levels. Thus, our conundrum: Is a king tide defined by its cause (lunar and solar constituents, atmospheric disturbances) or its effect (observed water levels and flooding)?" And when sea level rise is predictable.
The gist of the matter is that tide levels (high, low, neap) are sea level concepts in the sense that the amount of sea water in the ocean at a given location and time is the critical factor for calculating how high or low a tide can be at any astronomical time as determined by Moon, Sun, and Earth relations to one another (they can only alter by gravity the existing sea surface at relevant locations by their combined gravitational influence).
As the quantity of sea water in the ocean changes, due to global warming induced ice sheet melt, it increases or decreases the potential high and low tide level changes the Moon, Sun, and Earth can bring about (Humble Oil-Qaeda).
Thus, the sea level history recorded in the PSMSL is the history of the maximum high and low tide reality at tide gauge stations around the Earth.
The way to calculate what the tide level has been, and what it will be in the future, is to note the sea level positions then calculate the impact that the Moon, Sun, and Earth's gravitational influences would have on that sea level at that location and time using Newton's law of gravitation.
An added bonus is that it tells us where houses will be falling into the ocean and where they will not (i.e. where sea level is falling and where it is rising).
Another bonus, in terms of what calculations to use, is that the astronomical changes in the Earth, Sun, and Moon will be permanently more consistent over time compared to the much less consistent sea level change calculations.
The global warming induced sea level change will continue (accelerating at difference rates from time to time) because the ice sheets will continue to melt, but at a much less predictable rate than orbiting timelines of the Moon and Sun (consistent over thousands, millions, or billions of years).
Even NOAA of the US government is 'in the business' of trying to get a handle on these events so people can be warned (Fig. 7).
See the video below which chronicles the ongoing lack of comprehension of those facts.
The next post in this series is here, the previous post in this series is here.