 |
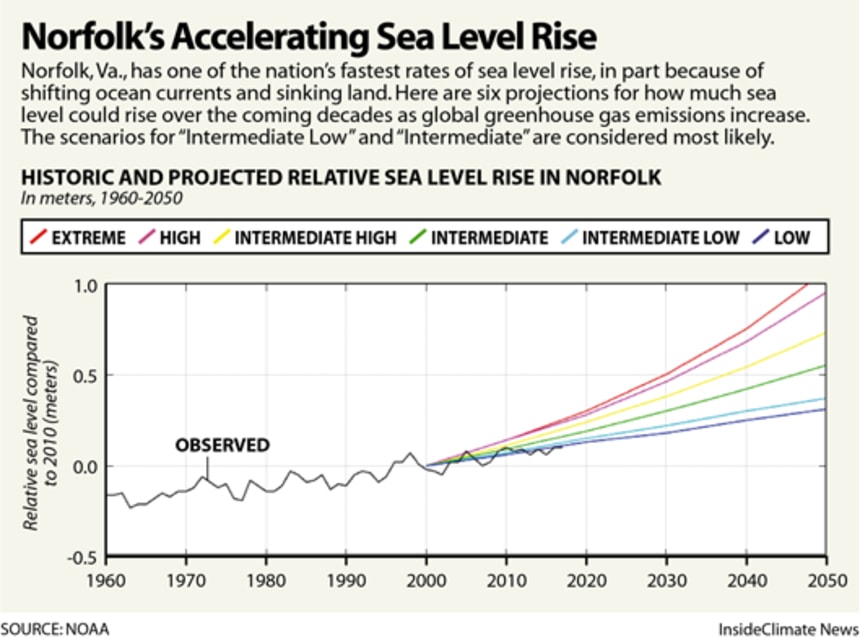
| Fig. 1 Seaport Damage Is Already Here (Nov. 2018) |
I. Background
Regular readers know that Dredd Blog has, for over a decade (c.2011), been focusing on the danger to seaports that sea level change (rise or fall) poses to world seaports (see e.g. Seaports With Sea Level Change, 2, 3, 4, 5, 6, 7, 8, 9, 10, 11, 12, 13, 14, 15, 16, 17, 18, 19, 20, 21, 22, 23, 24, 25).
The graphic at Fig. 1 points out that sea level rise is a common concept now, however, it also points out that the estimates of the amount of future sea level change that will take place over most any given time frame varies.
There are several well-known reasons that people, even some scientists, do not want to understand the realities of sea level change:
"They are believed or not based on the realm of superficial 'knowledge' which is basically belief or faith in other people (The Pillars of Knowledge: Faith and Trust?).
Sometimes the realm of commercial interests, academics, scholars, media, and scientists don't have all of the information that bears upon a disastrous scenario.
 I mean all the information available that they could have, whether that lack of information is by choice, unawareness, or poor research techniques.
For example, none of the following papers have any mention of sea level fall (Sea‑level rise in ports: a wider focus on impacts, Extreme sea levels on the rise along Europe’s coasts, Impacts of climate change on transport).
Dr. Mitrovica (see video below) traveled to one of the nations in the geographic region focused on in those papers, to inform them of some of the relevant dynamics involved, but they could not believe him."
(Seaports With Sea Level Change - 14). A recent IPCC report chapter of over a thousand pages long does not mention seaports (only a footnote on page 1019 does).
That footnote has no reference number (no sequence number, but neither do the others); I found it by searching the entire chapter for "sea ports" since there was no reference in the main text of the paper: |
| Fig. 2 |
"ILeón-Mateos, F., A. Sartal, L. López-Manuel and M. A. Quintás, 2021:
Adapting our sea ports to the challenges of climate change: Development and
validation of a Port Resilience Index.
Mar. Policy., 130, 104573."
(IPCC Chap 6 Infrastructure, inordinate footnote). I have followed the trail of that reference, using "the Google", to a relevant paper concerning sea ports, which reads:
 |
| Fig. 3 |
"Climate change is one of the issues of greatest concern to today’s society. The increase in temperatures has affected sea levels, polar masses and extreme events, among others. There are many scientific studies that analyze the impacts of climate change on coastal communities, but most of them focus on beach erosion and coastal recession. Scientific literature on the effects of climate change on ports and harbors and their adaptation is much less abundant. Ports are essential for the economy and society of their cities, so studying the impact of climate change on them is an urgent need."
(Review of the Impacts of Climate Change on Ports and Harbours and Their  Adaptation in Spain, emphasis added). Wow!
For the life of me I can't understand the reason for not putting the danger to seaports out in front (perhaps this is instructive: Oil Qaeda admits to gaslighting public over green aims).
That "urgent need" is going to grow much faster than the reaction to it is (Exceeding 1.5°C global warming could trigger multiple climate tipping points; This Hot  Summer Is One of the Coolest of the Rest of Our Lives; The Same Old New IPCC and The Same Old New IPCC).
The port authorities are somewhat like their scientific counterparts, in that they exhibit character or behavior that seems to be somewhere between unknowing and uncaring or at least incapable of doing anything about it.
That is, they seemingly aren't even aware of the need to do something that is not as difficult as restructuring a seaport, i.e., curtailing green house gas emissions which exacerbate the danger to seaports while increasing the various emerging emergencies:
 "Despite the International Maritime Organization’s ambitious goal to drastically reduce greenhouse gas emissions by 2050 by 50%, a large portion of maritime ports do not publicly provide port air emissions
reporting. It is suspected that the lack of publicly available reporting constitutes its internal absence as well."
"Despite the International Maritime Organization’s ambitious goal to drastically reduce greenhouse gas emissions by 2050 by 50%, a large portion of maritime ports do not publicly provide port air emissions
reporting. It is suspected that the lack of publicly available reporting constitutes its internal absence as well."
(Classifying maritime port emissions reporting, emphasis added). I appreciate that information because it is better than the "depraved heart murder" character of those who ignore everything concerning the urgent situation.
The oil industry mentioned above ("Oil Qaeda") is known for its gaslighting the public for decades, which has convinced some scientists to gaslight too (Florida is Not Going Underwater).
 That post by
One thing that is important to remember about seaports is that
they are the lowest points for any state or country, i.e., they are
built at the sea level existing at the time of their construction.

At any seaport, any remedy for sea level change depends on whether that seaport is gaining or losing water, but those remedies will become less and less effective as sea level change increases over time (dredging can only go so far, same with lifting).
Even now, as shown in Fig. 1, sea level determined by tides and sea level change can mandate what activities can be done or on the contrary can't be done at some seaports (high-tide activities different from low-tide activities).
II. Graphs
Today, as you have noticed, I have included some color enhanced graphs of sea level change at various coastlines with tide gauge stations around the globe.
All graphs begin in the year 1800, have different measured (in situ) years, and then end at the year 2050.
Thus, the three sections include an estimated past, a measured span of years, ending with an estimated future span of years.
The three sections vary in length determined by the actual measurements available from PSMSL tide gauge records.
Other graphs without color enhancements are in the following appendices (Coastlines 040-555, Coastlines 605-950).
The important factors on all of the graphs, color enhanced or not, are specified as:
"H:" for the estimated sea level change span of time prior to the tide gauge installation; "Measured:" for the in situ measurements recorded by the tide gauge equipment while operative; and "F:" for the estimated sea level changes after in situ measurements ceased to be reported.
"SLC" (sea level change) values are also shown on the right side of the graph; values are given for the H (historical), measured, and F (future) categories in that order; those values are in inches or feet depending on the total sea level change amount.
The "estimates" portions do not contain any increased or decreased acceleration quantities, instead, the acceleration change amounts are based on measured acceleration change amounts that have taken place at that site.
Some of the color enhanced graphs are not marked with the "Fig." designation, but they do have the same information about the sea level change factors as Fig. 2 and Fig. 3.
And most importantly, the graphs are composites of all the tide gauge stations in a particular coastline area, which is the "Coastline" column on the PSMSL list.
For example "Coastline 050" contains the following tide gauge "ID" locations (31, 68, 69, 70, 72, 73, 74, 77, 78, 88, 90, 97, 99, 122, 140, 170, 179, 203, 323, 330, 1211, 1236, 2101, 2102, 2103, 2104, 2105, 2106, 2107, 2108, 2109, 2110, 2111, 2112, 2113, 2132, 2133).
The tide gauge station values are used if they have 50 years or more of recorded data.
Those values are averaged into one value per year then used to generate the graph of that coastline area.
III. Closing Comments
Anyway, two of those color enhanced graphs detail sea level change in the same coastline area (PSMSL Coastline 050), but one type of change is sea level rise (Fig. 2) and the other is sea level fall (Fig. 3).
I am using Fig. 2 and Fig. 3 to illustrate that one coastal area (PSMSL Coastline) can have both sea level fall and sea level rise (The Bathtub Model Doesn't Hold Water).
To record sea level fall, a tide gauge station must be within the "hinge point" distance from a large ice sheet on land (The Evolution and Migration of Sea Level Hinge Points).
Outside of that distance is beyond the gravitational pull of the mass of the ice sheet (ibid), so the type of sea level change on the other side of the hinge point is sea level rise.
Of course other factors such as land rise or fall caused by vertical crustal movement (earthquakes, etc.) can change a tide gauge station's records from sea level rise to fall and vice versa, but today I am primarily focusing on cases where the land surface level is stable.
Check out the videos below if you haven't already.
The next post in this series is here, the previous post in this series is here.
I am still not seeing any real evidence that sea level rise is being taken seriously enough. "Rebuilding" in the same dangerous locations always takes precedent. Retreat isn't even in the vernacular.
ReplyDeleteIt's obvious that humans aren't going to defeat the ocean, or even climate change for that matter. Discussion of "adaption" and "mitigation" never includes admitting we've made some truly stupid decisions about where to live and build. So many locations are on sand spits that are just waiting for devastation to happen.
It's hard to feel sorry for stupidity, but compassion for the suffering is still there, but not for the insistence that they're going to just go back and repeat the same mistakes as before.
Planners aren't too bright or well-informed, or deliberately vested in just keeping the profit paradigms running for as long as possible. Whatever. You can't fix stupid. It seems that the harder we try to warn, the more they ignore.
Anonymous,
DeleteIndeed. Seaports continue to be built at the lowest point above sea level in every city, county, state, and nation. That would be Elevation Zero above sea level. In other words, the most vulnerable place for upcoming sea level change. Conundrum?
Meanwhile ... (UN chief: World is in `life-or-death struggle’ for survival)
ReplyDeleteSea level has risen ~1.5 ft. in Atlantic City (coastline code 960) since 1910 but they aren't going to do what some other Jersey cities are (Link).
ReplyDelete