 |
| WOD Layers (A World of WOD Zones) |
I. New Stuff
The World Ocean Database (WOD) updated its WOD18 (2018) data (WOD18) again.
So, I downloaded all of it via FTP using the Wget command.
I then constructed CSV files by converting the WOD Format into CSV format., then quick loaded the CSV data into the SQL tables for more efficient access (cf. An Updated World Ocean Database).
 |
| Pelagic Depths |
It is a lengthy process seeing as how there are a few billion measurements to parse in order to isolate those required for Thermodynamic Equation Of Seawater usage (TEOS-10).
I indicated in this post that I would show some of the new graphs "In the coming days ...", so the first ones have been added to this post.
To detect any changes between the latest WOD18 data in the graphs in this post and the graphs in the first release of WOD18 data, compare these graphs (latest data of all zones and layers) with previous WOD18 data: Patterns: Conservative Temperature & Potential Enthalpy - 3.
Note also that the depths involved are the pelagic depths shown in the graphic titled "Pelagic Depths".
II. Parsing
 |
| Epipelagic |
 |
| Bathypelagic |
 |
| Mesopelagic |
 |
| Abyssopelagic |
 |
| Hadopelagic |
I also skip the cast details about the research vessel and the scientific research participants.
Skipping those social and biological details requires parsing some 1,224 compressed files (tar.gz) totaling 22.5 gigabytes (GB) which equates to 73.4 GB when uncompressed.
That isn't the end of it, because some of the uncompressed files are several GB in size, so I have to divide them into smaller files prior to processing due to available RAM (computer memory) constraints.
III. About The Datasets
The graphs are depictions of all measurements in all layers and zones of the WOD18 dataset that I use as explained in the first post (I don't use the XBT, SUR, or MBT datasets because they do not have each and every measurement type required).
I require without exception the date, latitude, longitude, temperature, salinity, and depth of in situ measurements (due to TEOS-10 requirements).
The datasets that I do not use are missing at least one of those values.
IV. About The Graphs
There are two graph designs involved in this preliminary release of the entire set of graphs.
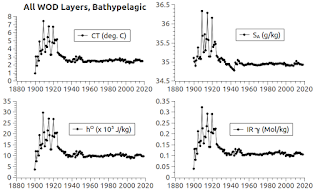
The first set involves four panes of data: upper left pane, upper right pane, lower left pane, and lower right pane.
The upper left pane shows Conservative Temperature (CT), the upper right pane shows Absolute Salinity (SA), the lower left pane shows Potential Enthalpy (hO) which is also known as Ocean Heat Content (OHC), and the lower right pane shows the OHC in terms of the quantity per kilogram (moles) of infrared photons (of wavelength 1 x 10⁻⁶ meters) in each cubic meter of ambient seawater.
 |
| Conservative Temperature (CT) |
 |
| Potential Enthalpy (hO) (a.k.a. Ocean Heat Content) |
 |
| Infrared Radiation |
 |
| Absolute Salinity (SA) |
These are the "ghost photons" that we don't hear much about because evidently it has been assumed that radiation of heat into the ice itself does not happen.
I don't know why only conduction and convection were thought of as the two ways glacial ice is melted.
Actually, the "third rail" (infrared photons) are radiated into the ice of tidewater glaciers that emerge from ice sheets in Greenland, Antarctica, or from other smaller tidewater glacier locations (The Ghost Photons, 2, 3).
That is, anywhere the ambient water molecules contain enough of those photons they will spontaneously radiate into the ice as indicated by the laws of thermodynamics.
Anyway, the other set of graphs are line graphs which depict the same values as the four-pane graphs do.
However, each line graph shows only one of the values (CT, SA, hO, or infrared photon radiation potential) at each of the five pelagic depths.
All depth values are shown in one presentation in the line graphs, but only one depth at a time is shown in the four-pane graph versions.
V. Closing Comments
The WOD folks indicated that in the WOD18 releases they have preceded the release of their data with closer quality constraints, plus they have added millions of additional casts to the datasets.
The new and additional data appears to be more recent data (21st Century stuff).
And finally, notice that the thermodynamic proportion between the CT, hO, and infrared data shows loud and clear (Patterns: Conservative Temperature & Potential Enthalpy, 2, 3).
These enhancements are another accolade for the TEOS-10 folks who know OHC better than the research scientists who don't yet get that relationship.
The next post in this series is here, the previous post in this series is here.
"Evidence of humans causing global warming hits 'gold standard'"
ReplyDeleteThat means "five-sigma" folks (The Hill)
The deniers are likely going to attack the WOD (link).
ReplyDelete