 |
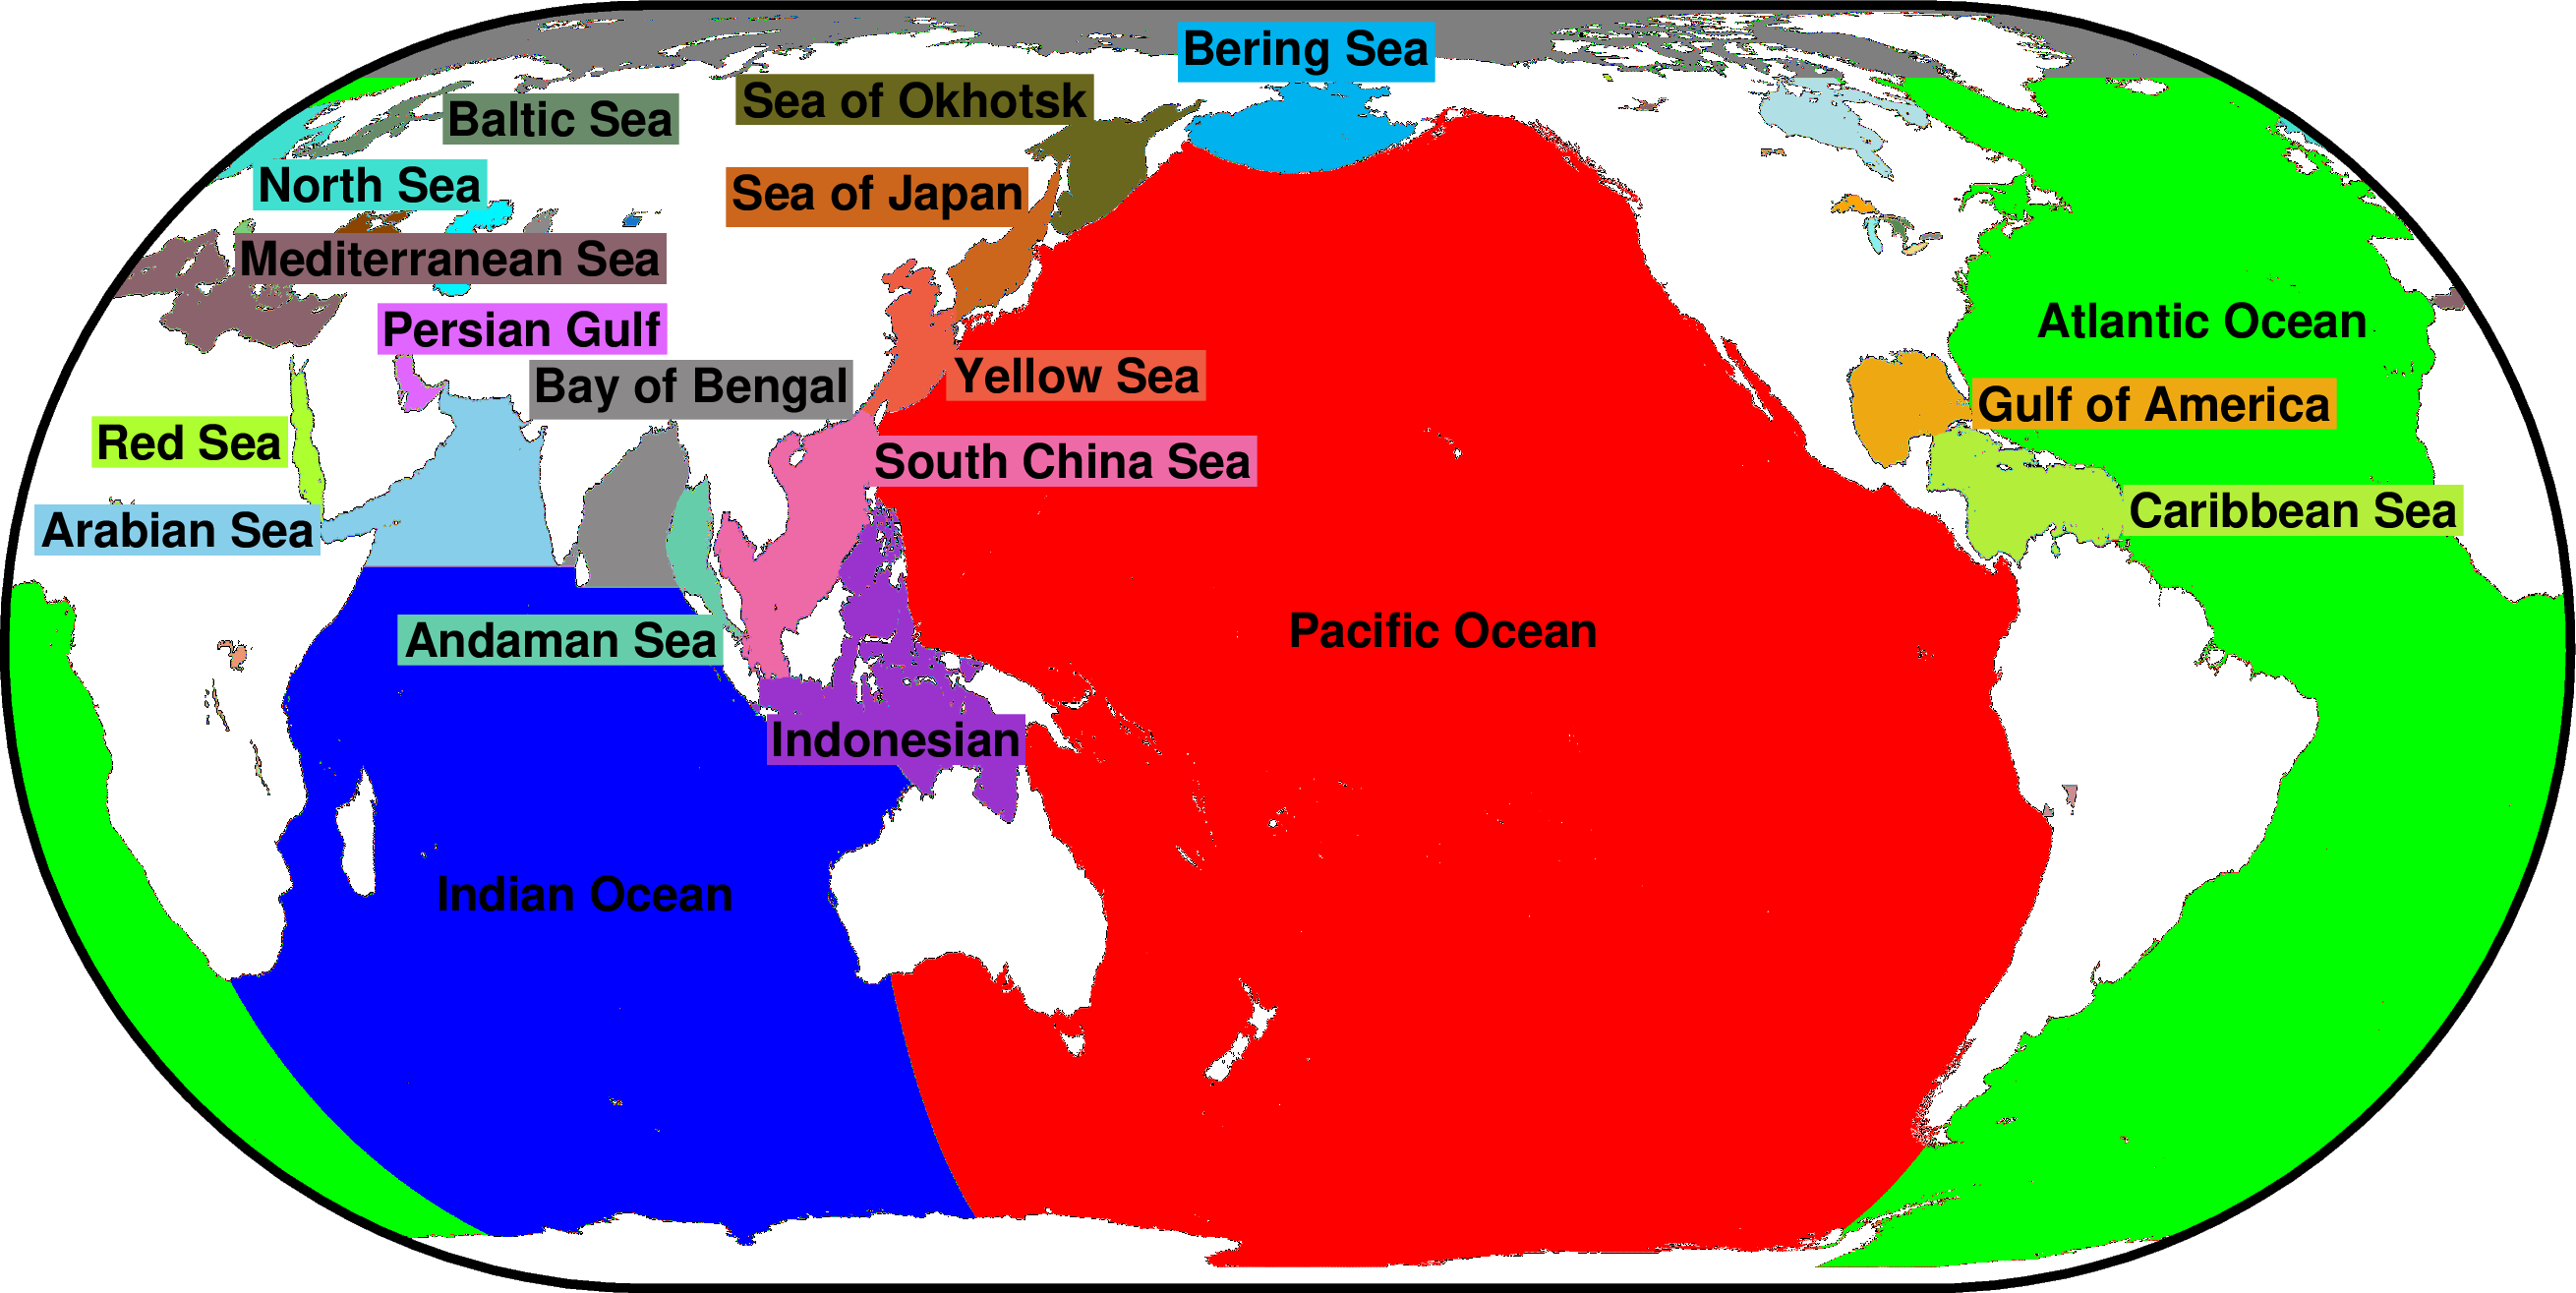
| Fig. 1 Ocean Areas |
Dredd Blog has used satellite data in sea level change scenarios in the past (On The More Robust Sea Level Computation Techniques, 2, 3, 4, 5, 6, 7, 8).
The most-recent post in this series took place in January of 2017.
So, today I am presenting appendices containing updated satellite records
which bring the annual coverage up to the year 2022; but to properly set the stage for the insertion of that satellite data, a comprehensive set of historical PSMSL data is utilized.
I am revisiting this series since there is more satellite data available now, and since the tide gauge station data is decreasing in quantity.
This decrease in quantity is taking place for several reasons mentioned here (notice especially Fig. 4 in that post).
In other words, I have blended the tide gauge station data (beginning circa 1800) with the much more recent satellite data (beginning circa 1992).
I think this approach is required for a stable viewpoint:
"The interest in the use of satellite altimeter data close to the coast motivated a research discipline now referred to as coastal altimetry. Although significant progress has been achieved in the past decades especially in radar technology innovation, development of advanced waveform retracking algorithms, and improved corrections, nonetheless, obtaining accurate sea level from satellite altimetry close to about 5–10 km of the coasts remains a challenge."
(Advances in estimating Sea Level Rise). Sea level data far from coasts is useful, and so is coastal sea levels, because the latter is where the harbors and sea ports are; which is where the heart of international commerce takes place: (Seaports With Sea Level Change, 2, 3, 4, 5, 6, 7, 8, 9, 10, 11, 12, 13, 14, 15, 16, 17, 18, 19, 20, 21, 22, 23, 24, 25, 26, 27, 28, 29, 30, 31, 32, 33).
The graphs presented today are a combination of value lines, with red value lines marking the high and low sea level ranges, blue lines marking the average of the high and low values, and green lines marking the in situ measurements of sea levels.
The most stark differences between these satellite sea level change values and tide gauge record values is that the satellite measurements are not limited to coastlines where tide gauge stations are located.
The satellite measurements are taken at latitude and longitude locations out to the furthest reaches of the oceans way off shore; but they both utilize "the geoid" concept.
Thus, there are two types of values in today's appendices.
One is the RLR (geoid) millimeters (complicated math calculations) and the other is straight millimeters (simple tide gauge floats moving up and down within a tube):
"In order to construct time series of sea level measurements at eachstation, the monthly and annual means have to be reduced to a common datum. This reduction is performed by the PSMSL making use of the tide gauge datum history provided by the supplying authority. To date, approximately two thirds of the stations in the PSMSL database have had their data adjusted in this way, forming the 'REVISED LOCAL REFERENCE' (or 'RLR' [geoid]) dataset. In general, only RLR data should be used for time series analysis."
(RLR Definition; cf. Ocean surface topography). The straight millimeters value on the graphs is acquired by recording the first RLR sea level value (earliest year) then subtracting that value from all subsequent RLR values to derive the anomaly value (Note that satellite these measurements begin circa 1992 and are the values that replace missing tide gauge station data that have ceased to exist; or authorities have stopped presenting data to PSMSL for some other reason such as sea level change damage done to tide gauge stations).
Anyway, here are the appendices composed of sea level change graphs at various ocean areas within them (ocean names are in alphabetical order: A-C 1800, G-P 1800, J-Y 1800; A-C 1992, G-P 1992, J-Y 1992).
The '1992' designation indicates measurements containing only the satellite values beginning in 1992 while the '1800' designation indicates measurements of tide gauge values beginning in 1800 with satellite data blended in from 1992 forward.
The previous post in this series is here.
"Now I wish I could write you a melody so plain
That could hold you dear lady from going insane
That could ease you and cool you and cease the pain
Of your useless and pointless knowledge"
No comments:
Post a Comment