 |
| From Wikimedia Commons |
I. Background
The news media are generally inadequate when it comes to global warming induced sea level change (SLC) reporting.
So, since somebody has to do it, today I present:
1) countries that are experiencing SLC;
2) a list of tide gauge stations in those countries;
3) links to PSMSL data for each station in each country;
4) graphs of the SLC of each country.
Since the amount of data is too much for one post, I have separated them into alphabetical posts with a matching appendix that contains the graphs of SLC for the countries listed.
II. Alphabetical Country Sections
Here are the links to sections of alphabetical lists of countries that have measured their coastal SLC changes over time:
| Tide Gauge Data | Appendices (Graphs) |
| Countries: A - C | A - C |
| Countries: D - G | D - G |
| Countries: H - L | H -L |
| Countries: M - O | M - O |
| Countries: P - T | P - T |
| Countries: U - Y | U - Y |
Each section contains an alphabetical list of countries along with a list of Tide Gauge Stations (stations) used to measure SLC at that location in that country.
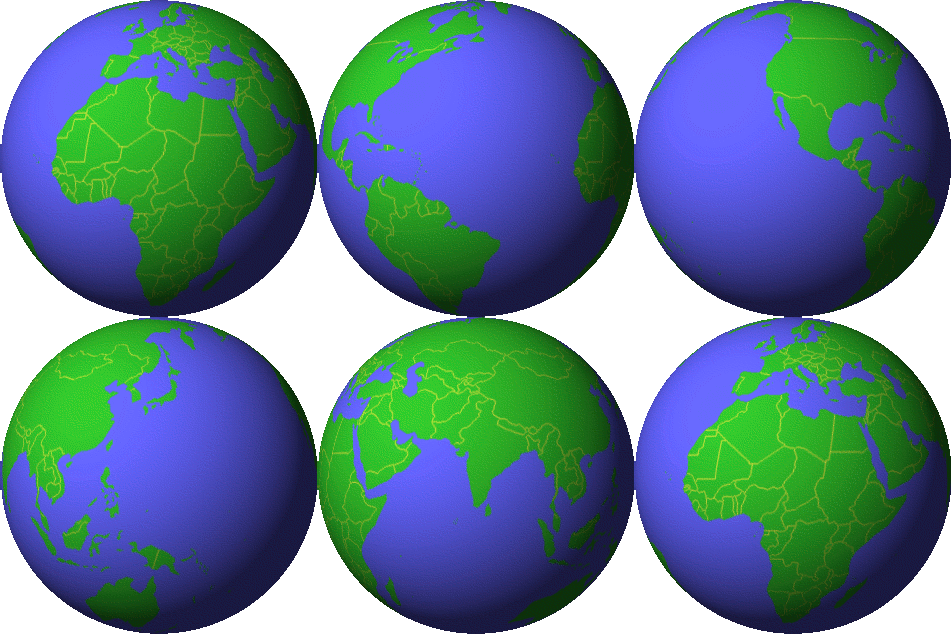
The stations are linked to the PSMSL data concerning that station, along with maps to give you an idea of where on the globe the country is located, and where the measurements take place along that country's coastline.
III. Graphs of Each Country's SLC
In addition to that, each alphabetical list contains a link to graphs of the SLC in each featured country.
The graph values are mean averages of both sea level fall (SLF) and sea level rise (SLR), which are the two components of SLC.
Readers can click on the links to the station data if you want to know which stations have SLR and which stations have SLC.
Note that the graphs have two sets of values.
One is "RLR mm" which means RLR measurement change from year to year, which is explained by the PSMSL site (RLR Definition).
The other is "mm" which means amount of change in millimeters from one year to the next.
IV. Closing Comments
There is a myth that poor countries will be the most impacted by global warming induced SLC (USA had world's 3 costliest natural disasters in 2018, The 1% May Face The Wrath of Sea Level Rise First).
The reality presented in this series is that the richest countries are just as vulnerable, if not more so, than poor countries are.
All a country needs to do in order to qualify for the catastrophic prospects of SLC is to have a coastline that is tidal.
This includes countries that are inland from a coast but use tidal rivers for commerce through ports.
The next post in this series is here.
Great work Dredd! Today in Straya, we have the top 15 hottest places on the planet. Usually, the propaganda that pretends to be helpful media promises ' it's just a cycle mate'- all good!
ReplyDeletehttps://www.canberratimes.com.au/environment/weather/the-world-s-15-hottest-sites-were-all-in-australia-amid-significant-heatwave-20190116-p50rmr.html
The 're-insurers' know the score-( Swiss Re, General Re etc) these aren't 1 in 100 year events as claimed to pacify the masses; more like 1 in 10.
"Rising Waters Are Drowning Amtrak's Northeast Corridor" (Bloomberg).
ReplyDelete