 |
| Pelagic Depths |
I. Background
In today's post I use World Ocean Database (WOD) data and TEOS-10 to calculate Ocean Heat Content (OHC) in the WOD Zones along the coast of China and the USA.
If you want to explore the nitty-gritty of OHC you can peruse the previous posts in this series (In Search Of Ocean Heat, 2, 3, 4, 5).
In the first post of the series, Professor McDougall was featured.
He discusses the problem in current software models when it comes to calculating OHC.
The second post talked about and used the updated WOD datasets of 2018, which updated their 2013 data.
 |
| China Conservative Temperature |
 |
| China OHC & SA @ Epipelagic |
 |
| China OHC & SA @ Mesopelagic |
 |
| China OHC & SA @Bathypelagic |
 |
| USA Seacoast Code 760, Abyssopelagic |
 |
| USA Seacoast Code 760, Bathypelagic |
 |
| USA Seacoast Code 760, Epipelagic |
 |
| USA Seacoast Code 760, Mesopelagic |
 |
| USA Seacoast Code 760, CT at depth |
 |
| USA Seacoast Code 821, CT at depth |
 |
| USA Seacoast Code 823, CT at depth |
 |
| USA Seacoast Code 940, CT at depth |
 |
| USA Seacoast Code 960, CT at depth |
The fourth post discusses and graphs the infra-red photon content of seawater using CT, hO (and among other things, Planck's Constant).
The fifth post reiterates some and talks about Gibbs and the exactness of his work, pointing out that Albert Einstein called Gibbs the greatest mind in American scientific history.
II. Some Typical Graphs
In today's graphs we apply that background to the coastal waters along the coast of China, which has only one coastline code (610).
That is the coastline where the busiest seaports of our current world civilization are located.
That background is also applied to the coastline codes of the USA where there US seaports are located (760, 821, 823, 940, and 960).
The busiest seaport in the USA is Los Angeles, which rates number 18 in the top twenty world seaports.
These rankings change from time to time (#1 can become #2, and on down the line), so one must recheck the list each year or so to stay current (Top 50).
The important lesson to keep in mind is that when one is using CT it pictures the pattern and trend of OHC, OHF, hO, and infra-red photon content of seawater (per kg).
In other words, the graphed CT pattern and trend as it moves up and down along a time line is also the pattern of OHC and OHF.
That is because, through Gibbs' formulas in the TEOS-10 toolbox, the thermodynamic equilibrium and proportionality is preserved (Patterns: Conservative Temperature & Potential Enthalpy, 2, 3).
That proportion holds for whatever portion of the ocean and at whatever depth the in situ measurements have been taken.
This makes it much easier to quickly detect ongoing changes anywhere there are measurements stored in datasets.
One can peruse graphs of CT, then decide where more focus is needed.
III. Future Research
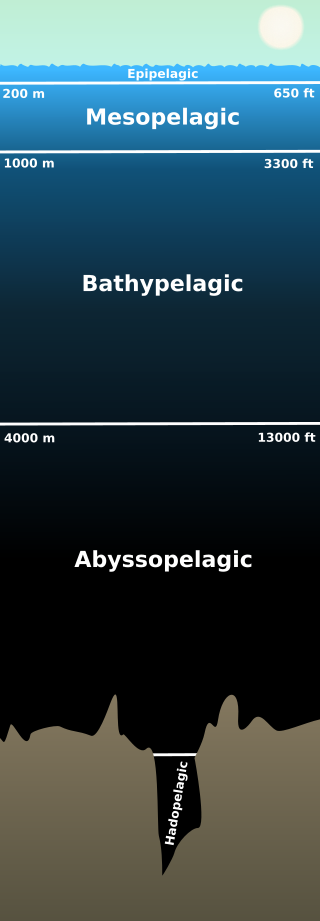
Researchers have continually pointed out that a major need at this time is to measure the Hadopelagic, the deepest depths.
Recently we saw a photograph of a plastic bag at the bottom of the ocean in the Hadopelagic (Plastic proliferates at the bottom of world's deepest ocean trench).
That plastic is even found inside the deep sea creatures (A Troubling Discovery in the Deepest Ocean Trenches).
That means we can also take temperature, salinity, and depth measurements while we are down there.
That is the scientific way to follow OHC and OHF so as to develop the complete picture.
It would also be instructive to periodically take the temperature of the ocean water at the bottom, as well as measurements to some shallow depth below the sandy surface of the ocean bottom.
I say that because if the bottom is cooler than the ocean water, the photons will flow from the sea water into the sand, and we could lose track of the OHC and OHF.
IV. Closing Comments
We hear a lot about the "missing ocean heat" so we should seek out and follow the infrared photon radiation where ever it takes us.
Lots of the "heat" carrying photons flow into cooler water around them, or into Tidewater Glacier ice, or into ice shelves.
Why would the photons not also do the same at the ocean bottom where the liquid seawater contacts cooler sandy solids?
There are several vast potential "hideouts" for infrared photons.
If we don't want to have missing OHC then we will have to add up ALL infrared photon radiation not only from all ocean depths, but also from those other places we aren't adequately measuring yet (The Photon Current).
The next post in this series is here, the previous post in this series is here.
The incompetent and dishonest EPA administrator says we should bury our heads in the sand, instead of our instruments of research (Discounting climate change, EPA chief faults the media for the rise of bad environmental news).
ReplyDelete"Youth Don’t want to be Scared by Climate Crisis: They Want Practical Solutions" (link)
ReplyDelete"In the climate crisis, power of our ocean is too great to ignore" (The Hill).
ReplyDelete