 |
| Fig. 1 Layer Nine |
Today, I am fixing the bug that stops the day-of-year at 300 instead of at 366 (see graphs, including yesterday's).
Future day-of-year graphs will have all 366 days (where there is data on those days of course).
I haven't spotted any other bugs.
Anyway, these beta graphs still tell us a lot about subsurface dynamics.
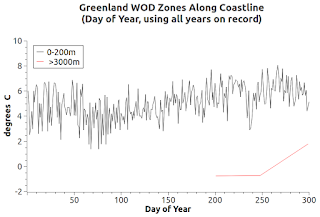
For a quick example, compare Fig. 1 with Fig. 2.
Notice the difference in temperature dynamics between Layer Nine (equatorial), in Fig. 1, and Greenland (Arctic area) coastal water temperatures in Fig. 2.
(The "Layers" concept was presented in the series: The Layered Approach To Big Water, 2, 3, 4, 5, 6).
 |
| Fig. 2 |
The Greenland lines blend and cross over so radically that I added graphs that have only two levels per graph (Fig. 3a - Fig. 3f).
Even with that limitation, the arctic area lines still blend more than the equatorial zone temperature lines do.
I plan to do these again sometime in the future, after splicing in the OMG dataset as it grows (OMG: Oceans Melting Greenland).
Getting back to today's graphs, I also added "Salinity" graphs in the same day-of-year format (Fig. 4a - Fig. 4g).
The Greenland water salinity values are more stable than the water temperature values are, except for the upper level (0-200m).
Notice the large drop in salinity at that upper level on about day 240 of each year (probably caused by a lot of fresh water flowing from the ice sheet).
Gotta get back to work now.
The previous post in this series is here.
 |
| Fig. 3a |
 |
| Fig. 3b |
 |
| Fig. 3c |
 |
| Fig. 3d |
 |
| Fig. 3e |
 |
| Fig. 3f |
 |
| Fig. 4a Salinity |
 |
| Fig. 4b Salinity |
 |
| Fig. 4c Salinity |
 |
| Fig. 4d Salinity |
 |
| Fig. 4e Salinity |
 |
| Fig. 4f Salinity |
 |
| Fig. 4g Salinity |
How about a rain driven spike?
ReplyDelete"Notice the large drop in salinity at that upper level on about day 240 of each year (probably caused by a lot of fresh water flowing from the ice sheet)."
That got me wonderin' Dredd as I figured the summer 'melt' would be cumulative. Day 240 is start of Aug in northern hemi.
Seem light rain can occur as early as April and continue on through the year before fading in Mar but 'peak' rain seems to occur in early August.
I've always figured the fastest way for nature to melt ice is not air temp alone. Add in the falling H20 (rain) and things really get underway. I'll see if ice extant is inversely correlated with rainfall.
https://weatherspark.com/averages/27549/Ilulissat-Jakobshavn-Kitaa-Greenland
Terrifo class today!
Mark,
DeleteWhat you said is a reality for sure.
Hurricanes, other moisture laden storms, etc., can really change salinity and/or temperature at times.
The plunge in salinity at about day 240 is based on something that happens every year in that time frame.
ReplyDeleteMelting is the best candidate.
Storms etc. are not that regular IMO.
Heavy Summer rains speeds up Greenland Melt.
ReplyDelete"The new study shows that these heavy rain events have occurred frequently due to the warmer, wetter weather of the last 20 years, penetrating deeper into the ice sheet, making it move and melt faster."
http://sciencenordic.com/heavy-summer-rain-greenland-speeds-ice-melt
If the natural system determines that the ice needs to be 'reduced' (or eliminated)you can be sure that 'rain' will be involved if speed is of the essence. By all objective measures, we are going to a new and different place; that is certain.
ReplyDeletehttps://www.newscientist.com/article/2124366-forget-snow-rain-will-become-main-precipitation-in-the-arctic/