 |
| Fig. 1 WOD Zones (Quadrants & Layers |
I just dropped in to update you on the progress of bringing the entire World Ocean Database (WOD) to Dredd Blog readers (see Databases Galore - 22 and 23).
The short and sweet of it is that I am modifying previous programs that analyzed WOD measurements using only the PFL and CTD datasets.
It is easy to change a small number of source code locations to have a program do the same thing to the new and expanded SQL database tables.
As an example, I changed a program that analyzed all WOD Zones by quadrant (four divisions of all WOD zones ... NW, NE, SW, and SE) and by zones.
 |
| Fig. 2a NE Quadrant |
 |
| Fig. 2b NE Quadrant (Zone 1813) |
Today's post does not present by layer, only by quadrant and individual zones within its particular quadrant.
Before I discuss the graphs, let me inform you that in addition to the WOD datasets (see Databases Galore - 22 and 23), I have added three specialty datasets (OMG, SOCCOM, and WHOI).
Regular readers know that OMG is Greenland specific, SOCCOM is Antarctica specific, and WHOI is Beaufort Gyre specific.
Those specialty measurements are not currently in the WOD so I add them to my SQL WOD database to enhance it.
On to the graphs.
 |
| Fig. 3a NW Quadrant |
 |
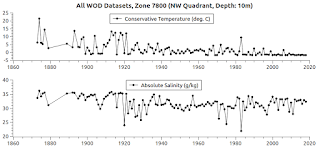
| Fig. 3b NW Quadrant (Zone 7800) |
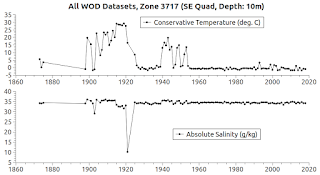
So, these graphs show the quadrants (Fig. 2a - Fig. 5a) and one zone from each quadrant (Fig. 2b - Fig. 5b).
 |
| Fig. 4a SE Quadrant |
 |
| Fig. 4b SE Quadrant (Zone 3717) |
I can't present them all in one post because that consists of several hundred zones.
Typically, in the past, I have presented zone data in a particular context (e.g. "Zones of the East Coast" ... "Zones of the West Coast") because of the enormity of the data sets (even when it was only CTD and PFL data) in the Dredd Blog SQL server.
At other times it was zone analysis by layer (e.g. 0-17 @ Fig. 1).
Anyway, the main point and the cause for my excitement is that we are now using it all to try to analyze it all.
BTW, as you can see by the use of Conservative Temperature and Absolute Salinity, the TEOS-10 toolkit is being used on the in situ data.
One thing, among several things, to remember is that the technology of the 1800's can be inferior but it can also be better at some things than modern technology (like tide gauges).
That said, we can always try to improve today's technology but the past records are what they are and can't be improved upon now.
 |
| Fig. 5a SE Quadrant |
 |
| Fig. 5b SE Quadrant (Zone 5717) |
I say that because there are some noticeable gyrations in the data, which can be corroborated with other older records such as rainfall, ice berg calving, earthquake, volcano, and other such records.
I have done that upon occasion, such as when there were sea level gyrations at stations near the Fukushima area following the tsunami there.
Another one was "sudden" salinity decreases in the Patagonia area after a volcano under the ice field at a high altitude erupted.
That sent incredible amounts of fresh water onto the surface of the ocean in that area, which was then picked up in CTD records soon after that eruption.
In today's news we read and hear of vast amounts of water being dropped on various areas in the states of N. and S. Carolina, and up from there to the Washington D.C. area.
This also happens over the WOD Zones in the ocean from time to time, and can cause temperature and salinity changes to take place when such deluges or rain making storms take place.
Deeper down, the same can take place when currents act up abruptly to cause what seems to be anomalous.
"Trust but verify" is a useful concept to use when we look at the data that records the aftermath of climate change.
Much more to come.
The next post in this series is here, the previous post in this series is here.
No comments:
Post a Comment