This is an appendix to: On Thermal Expansion & Thermal Contraction - 48
Overview of conditions
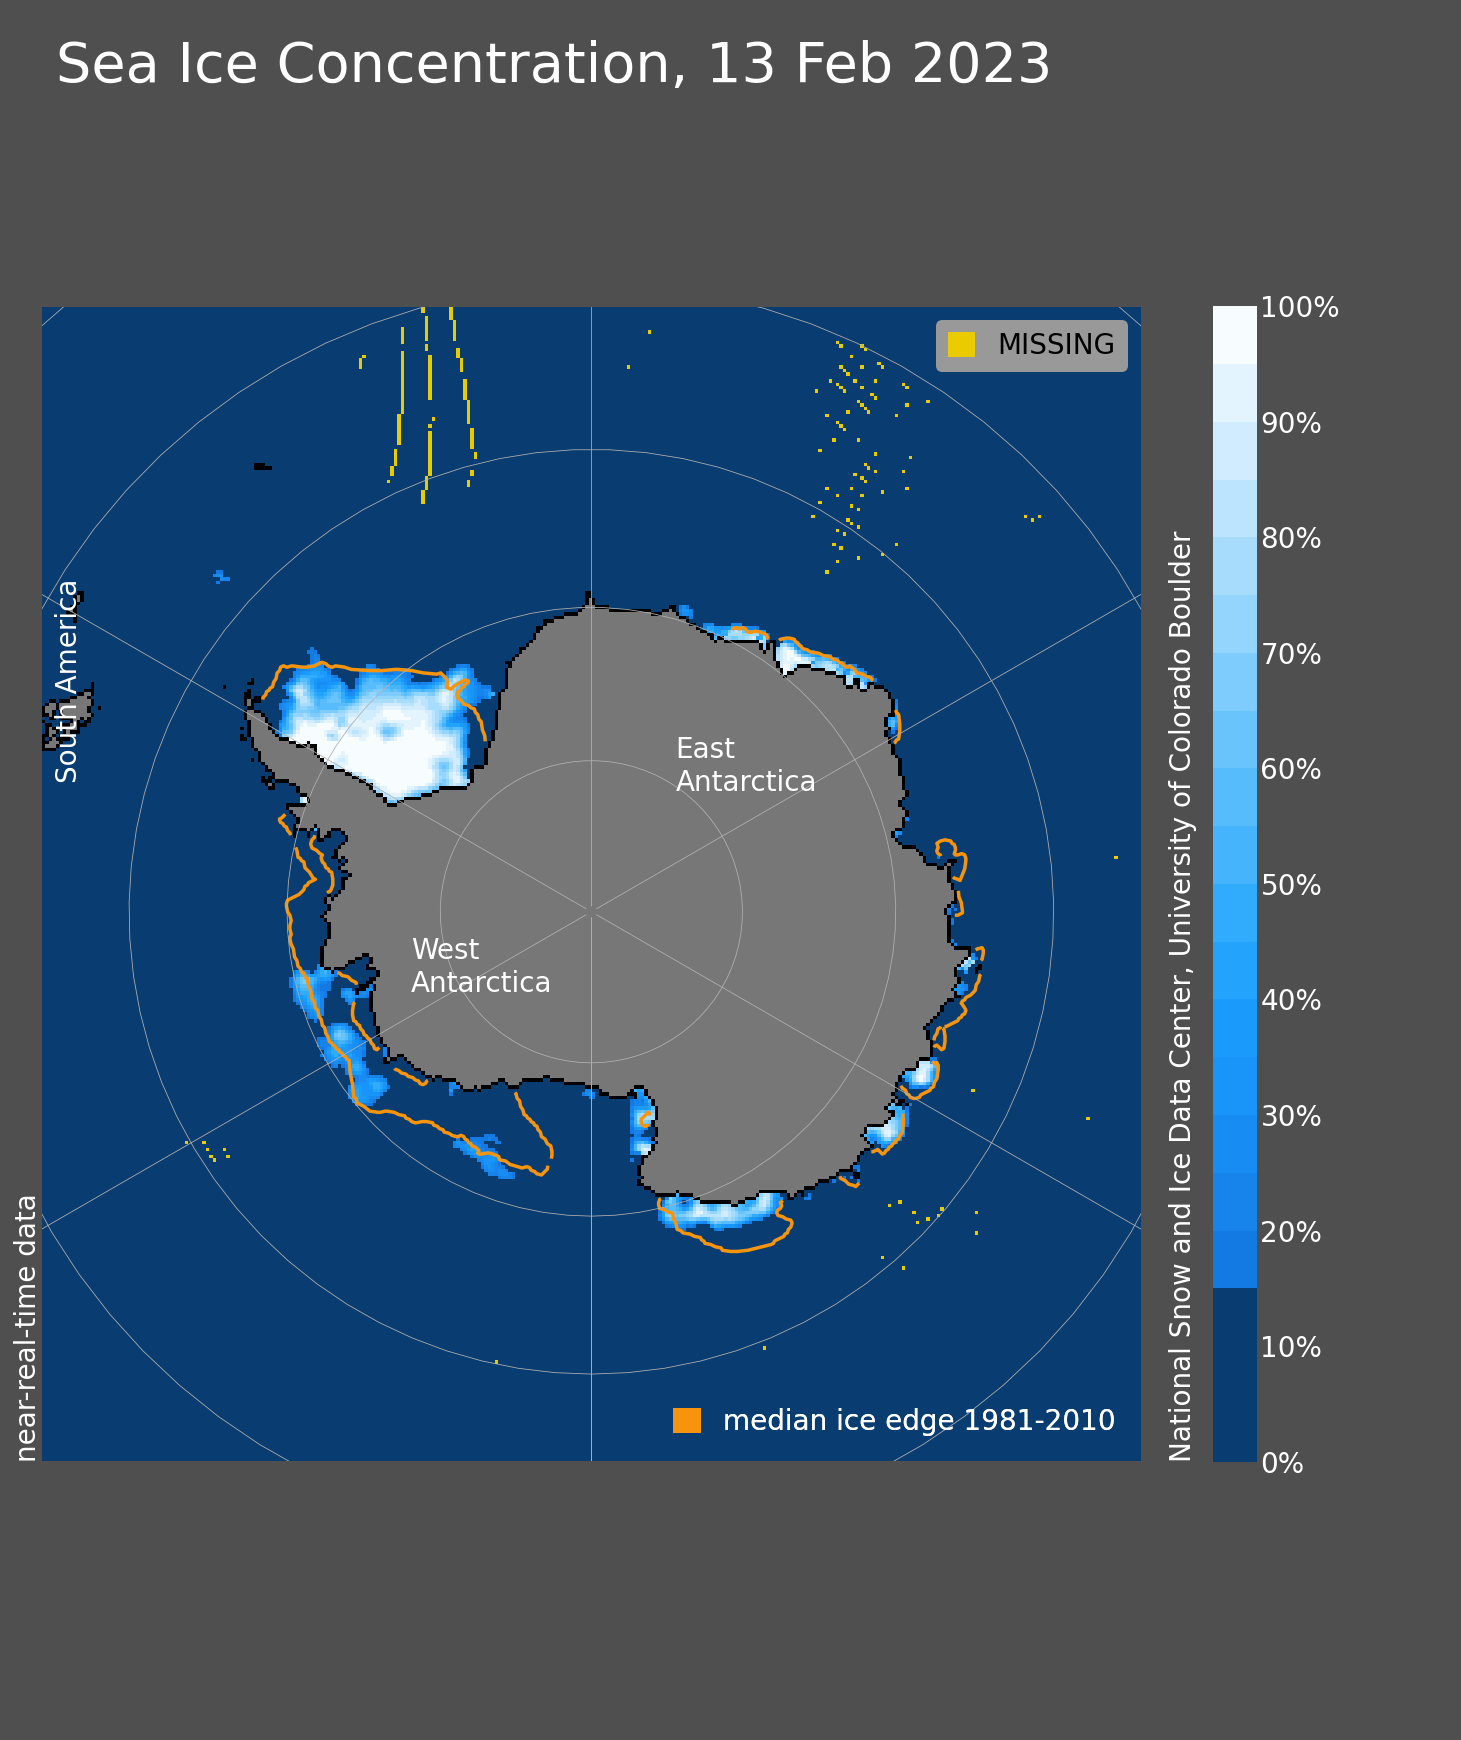
Figure 1a. This map of Antarctica shows many low areas of sea ice concentration, depicted as darker blues, surrounding the continent, rendering extent likely to decrease in the coming days or weeks. Antarctic sea ice extent for February 13, 2023, was 1.91 million square kilometers (737,000 square miles). The orange line shows the 1981 to 2010 median extent for that day. Sea Ice Index data. About the data
Credit: National Snow and Ice Data Center
High-resolution image
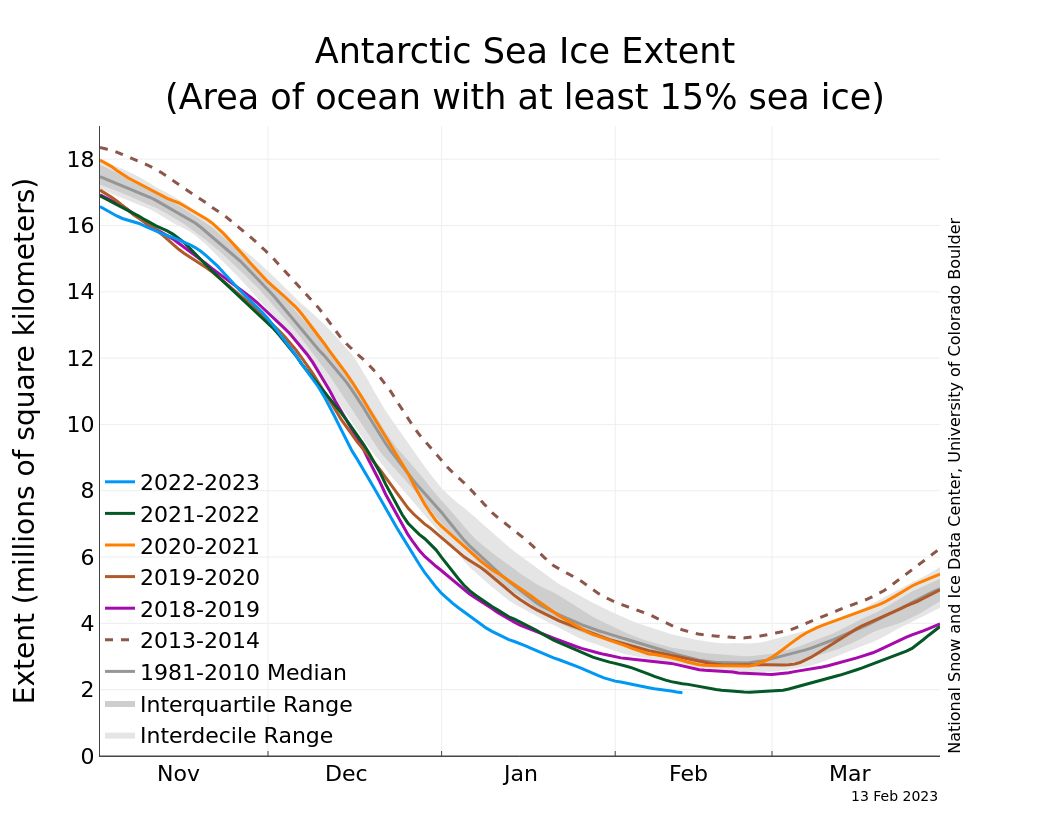
Figure 1b. The graph above shows Antarctic sea ice extent as of February 13, 2023, along with daily ice extent data for four previous years and the record high year. 2022 to 2023 is shown in blue, 2021 to 2022 in green, 2020 to 2021 in orange, 2019 to 2020 in brown, 2018 to 2019 in magenta,and 2013 to 2014 in dashed brown. The 1981 to 2010 median is in dark gray. The gray areas around the median line show the interquartile and interdecile ranges of the data. Sea Ice Index data.
Credit: National Snow and Ice Data Center
High-resolution image
On February 13, 2023, Antarctic sea ice extent fell to 1.91 million square kilometers (737,000 square miles) (Figure 1a). This set a new record low, dropping below the previous record of 1.92 million square kilometers (741,000 square miles) set on February 25, 2022 (Figure 1b). This year represents only the second year that Antarctic extent has fallen below 2 million square kilometers (772,000 square miles). In past years, the annual minimum has occurred between February 18 and March 3, so further decline is expected.
Conditions in context

Figure 2. This graph shows Antarctic annual sea ice minimum extent, depicted as black diamonds, from 1979 to 2023, based on a 5-day running average
of daily extent. The grey diamond data point depicts the 2023 minimum, which is still preliminary, with further loss expected. The linear trend line is in blue with a 0.9 percent per decade downward trend, which is not statistically significant. A five-year running average is shown in red. As the Antarctic melt season is still in progress, depicted as a grey downward arrow, the linear trend and running average will change slightly.
Credit: W. Meier, NSIDC
High-resolution image
Antarctic sea ice extent has been highly variable over the last several years. While 2022 and 2023 have had record low minimum extent, four out of the five highest minimums have occurred since 2008. Overall, the trend in Antarctic minimum extent over 1979 to 2023 is near zero. The current downward linear trend in the Antarctic minimum extent from 1979 to 2023 is 2,400 square kilometers (930 square miles) per year, or 0.9 percent per decade, which is currently not statistically significant. Nevertheless, the sharp decline in sea ice extent since 2016 has fueled research on potential causes and whether sea ice loss in the Southern Hemisphere is developing a significant downward trend.
Greenland and Antarctic Ice Sheet Today