 |
| Confusion about area2 and volume3 |
Also, we have looked at how supposedly grown up sophisticates look at the same problem.
The rub comes when we point out that the fifth graders get it and can answer the problem correctly ... but the sophisticated grown ups cannot.
What gives?
Well, it is a classic study in denialism of the type we discussed yesterday (The Peak of Sanity - 9).
Even the people at LiveScience do not seem to want to keep up with the fifth graders on this subject.
They still want to confuse ice extent (ice2) with ice volume (ice3) so as to perpetuate the myth they created, i.e., the myth that Antarctic Ice is increasing while Arctic Ice is decreasing.
How could this myth survive the new satellite data revelations?
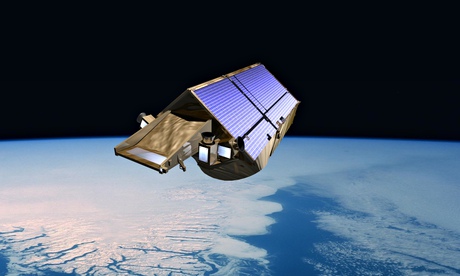
Look at the science of today produced by a specialized satellite:
The planet's two largest ice sheets – in Greenland and Antarctica – are(How Fifth Graders Calculate Ice Volume - 4, emphasis in original post). The answer the fifth graders come up with, as does NASA, as does the team of scientists and engineers who operate the specialized satellite, is that ice volume at both poles is decreasing at the astonishing rate we have only recently discovered.
now being depleted at an astonishing rate of 120 cubic miles each year. That is the discovery made by scientists using data from CryoSat-2, the European probe that has been measuring the thickness of Earth's ice sheets and glaciers since it was launched by the European Space Agency in 2010.
Even more alarming, the rate of loss of ice from the two regions has more than doubled since 2009, revealing the dramatic impact that climate change is beginning to have on our world.
And that rate is accelerating alarmingly.
Nevertheless, the science writer at LiveScience conflates and confounds the issues involved with calculating ice volume, to wit:
For an unprecedented third year in a row, Antarctica's sea ice is poised to smash a new record this month.(Antarctica ... Sea Ice ... High, Arctic Ice ... Shrinking, emphasis added). The answer of course is that Oil-Qaeda pays much more money for "good press" than green environmentalists do.
The Southern Hemisphere's unrelenting winds and frigid air froze ocean water into 7.6 million square miles (19.7 million square kilometers) of Antarctic sea ice this southern winter, the National Snow and Ice Data Center (NSIDC) said yesterday (Sept. 16).
With several more weeks of growth to go, Antarctica's sea-ice extent could soar well above the records set in 2012 and 2013. For now, only 88,800 square miles (230,000 square km) separate the 2013 and 2014 high marks.
Sea-ice extent is the total ocean area in which the ice concentration is at least 15 percent, as measured by satellite.
Arctic ice loss
Antarctica's record-breaking ice growth contrasts with shrinking sea ice in the Arctic. The Arctic ice cap hit its summer minimum of 1.96 million square miles (5.07 million square km) on Sept. 15, the NSIDC said. Covering an area roughly twice the size of Greenland, the expanse is the sixth lowest minimum since satellite tracking started in 1979. The numbers are essentially the same as 2013's low of 1.97 million square miles (5.1 million square km), the NSIDC said.
They pay people not to know that ice "extent" is an expression of how much area, in square miles or square kilometers, the ice covers, while ignoring that ice "volume" is an expression of how much quantity or volume of ice exists, in cubic miles, or cubic kilometers:
(How Fifth Graders Calculate Ice Volume - 2). The fact that the amount of ice at both poles is decreasing, Decreasing, DECREASING, is all we need to know.
Location Potential sea-level rise,
(m)East Antarctic ice sheet West Antarctic ice sheet Antarctic Peninsula Greenland All other ice caps, ice fields, and valley glaciers Total [Note: 80.32 meters equals 263.5 feet]
How much ocean the decreasing ice volume covers in square miles or square kilometers is utterly irrelevant to how much ice volume there is (How Fifth Graders Calculate Ice Volume).
The deceitful writers who try to confuse us, by insinuating that the ice at one pole is decreasing, while ice at the other pole is increasing, are deceitful or ignorant ... or both (Agnotology: The Surge, 2, 3, 4, 5, 6, 7, 8, 9, 10, 11, 12).
UPDATE (12/15/14): A dishonest writer, Jonathan Amos, of the BBC writes a falsehood post (Arctic sea ice volume holds up in 2014).
It is false because the ice volume continues to diminish at an accelerating rate:
New results reveal combined ice volume loss at an unprecedented rate of 500 cubic kilometres a year.(ESA Cryosat Website, 20 August 2014, emphasis added). The BBC writer of the wrong story, Jonathan Amos, is not quite a fifth grader yet.
...
It is important to assess how ice-sheet surface elevation and thickness across Greenland and Antarctica is changing to understand how they are contributing to sea-level rise.
Using an astonishing 200 million data points across Antarctica and 14.3 million across Greenland collected by CryoSat, the team were able to study how the ice sheets changed over the three years.
The resulting maps reveal that Greenland alone [by itself] is reducing in volume by about 375 cubic kilometres a year.
The two ice sheets combined are thinning [losing volume] at a rate of 500 cubic kilometres a year, the highest rate observed since altimetry satellite records began about 20 years ago.
The researchers say the ice sheets’ annual contribution to sea-level rise has doubled since 2009.
Glaciologist Angelika Humbert, another of the study’s authors, added, “Since 2009, the volume loss in Greenland has increased by a factor of about two and the West Antarctic Ice Sheet by a factor of three.
The previous post in this series is here.
Every year from now on is the "lowest ice year" for the amount of ice at each pole.
ReplyDeleteCBS has the same problem.
ReplyDeleteWhy is squared and cubed so difficult for maladjusted adults to grasp?
link
Sanity and ice have a common thingy.
ReplyDeleteSlip sliding away (NOAA: Record Antarctic Sea Ice Growth Linked To Its Staggering Loss Of Land Ice).