 |
| Fig. 1 SLR Software |
First, one must study the current science and current software, place relevant data into a database of some sort, so that expressing the science is a function of reading valid data, not to mention having a patriotic red, white, and blue display screen to enthral the deniers (Kleenex to wipe off the patriotic drool not included).
The graphic, Fig. 1, shows the Linux version 1.00 initial display screen (it is a console application, not a GUI).
I used the Code::Blocks IDE, wrote the software in C++ source code, then compiled it using the Gnu C++ compiler ("g++").
 |
| Fig. 2 (click to enlarge) |
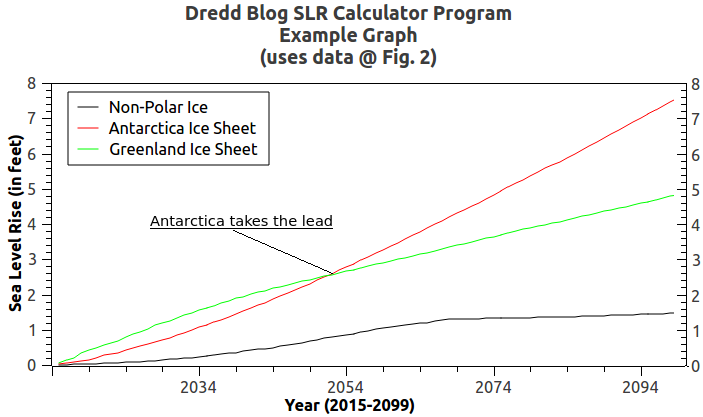
The graphic Fig. 2 shows the data values which generated the graph at Fig. 3.
Changing the data values changes the output, which changes the graph ("follow the data" is the equivalent of "follow the money").
Some data are more influential, i.e. will cause greater changes to the output, than other data.
One can learn a lot about individual data that drives SLR by hypothetical "what if" experiments.
 |
| Fig. 3 (click to enlarge) |
This format makes it easier to experiment with ranges of data values, which all the researchers tend to use these days (e.g. "a range of 3 to 6 feet by year X").
Exact estimates are fine, however, the better practice is to give a range because there are uncertainties and there are certainties.
For example, acceleration of SLR is a certainty, however, "exactly how much?" and "exactly when?" are uncertainties (The Question Is: How Much Acceleration Is Involved In SLR? - 4).
Another certainty is that, at some time in the future, Antarctica will overtake Greenland as the main contributor to SLR (model SLR software should simulate that), but "exactly when?" that swapping will take place is an uncertainty.
The better one understands the locations (Antarctica, Greenland) and zones (coastal, inland 1, inland 2, and no melt) where the melt and ice calving is taking place, and the better one keeps the data fresh, the more the uncertainties are diminished (see section "SEA LEVEL RISE (Melting Ice @poles and elsewhere)" on the Series Posts Page).
The next post in this series is here, the previous post in this series is here.
"Another certainty is that sometime Antarctica will overtake Greenland as the main contributor to SLR (model SLR software should simulate that), but exactly when that swapping will take place is an uncertainty."
ReplyDeleteIn late March of this year Antarctica was warmer than much of the north east U.S.
"Air temperatures reached record high levels at two Antarctic stations last week, setting a new mark for the warmest conditions ever measured anywhere on the continent. On March 23, at Argentina’s base Marambio, a temperature of 17.4° Celsius (63.3° Fahrenheit) was reached, surpassing a previous record set in 1961 at a nearby base, Esperanza. The old record was 17.1° Celsius (62.8° Fahrenheit). However, Esperanza quickly reclaimed the record a few hours later on March 24, reaching a temperature of 17.5° Celsius (63.5° Fahrenheit)."
(link)
With temps like that, people may be heading there for vacations in the future (as it gets overly hot here).
ReplyDeleteTom
That would make a scene like the deaths of people in the Mediterranean area, who have been forced to migrate because of the oil wars.
DeleteThat area will become much more deadly, in the near term, than it is now.
(BTW, I posted your comment on DNA @ The Uncertain Gene - 11)
The Ed Show is covering SLR (link)
ReplyDelete