|
| Fig. 1 WOD Layers |
I. Background
Today's post takes a new look at how we can understand the thermodynamics of seawater.
Specifically, this post is about CHANGE in the "heat content", that is, change in the "potential enthalpy" of a mass unit of seawater.
The basic technique of measuring the change in the heat content of seawater at various depths has been explained by oceanographers in published papers; (e.g. Potential Enthalpy: A Conservative Oceanic Variable for Evaluating Heat Content and Heat Fluxes, McDougal 2003, pp. 945-46).
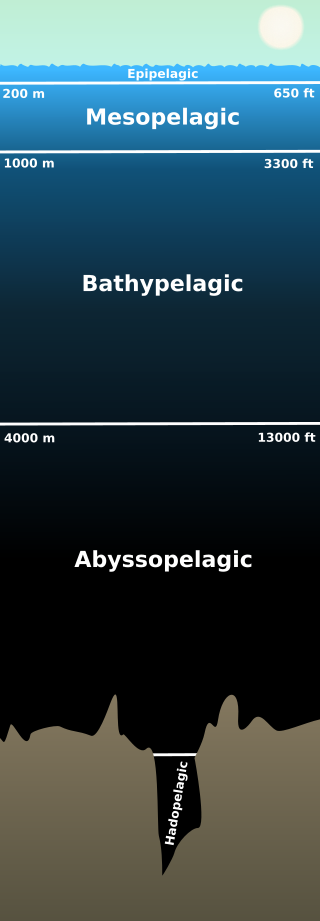 |
| Fig. 2 Pelagic depths |
II. The Advanced Approach
Albert Einstein said that when researching and reporting on scientific matters we should "make things as simple as possible, but no simpler" and Dr. Jerry Mitrovica said "the best physics is the simplest physics."
Since we are talking physics when we talk about the laws of thermodynamics at play in seawater, as regular readers know, we are talking about why I use the TEOS-10 software toolbox:
"In 2010, the Intergovernmental Oceanographic Commission (IOC), International Association for the Physical Sciences of the Oceans (IAPSO) and the Scientific Committee on Oceanic Research (SCOR) jointly adopted a new standard for the calculation of the thermodynamic properties of seawater. This new standard, now also endorsed by the International Union of Geodesy and Geophysics (IUGG), is called TEOS-10 and supercedes the old EOS-80 standard which has been in place for 30 years. It should henceforth be the primary means by which the properties of seawater are estimated."(TEOS-10 Primer, p. 2 PDF, emphasis added). For an extensive elaboration on TEOS-10, see also: McDougall, T.J. and P.M. Barker, 2011: Getting started with TEOS-10 and the Gibbs Seawater (GSW) Oceanographic Toolbox, 28pp., SCOR/IAPSO WG127, ISBN 978-0-646-55621-5.
As I explained in the first post of this series, the TEOS-10 toolbox offers a very simple way of determining heat content, in terms of computer software functions:
The potential enthalpy (hO) is calculated as specific enthalpy (h) minus dynamic enthalpy (h‡) using two TEOS-10 functions:(In Search Of Ocean Heat). Since that is simple physics, according to those far more knowledgeable than I am, it is the best physics.
h = gsw_enthalpy_ct_exact
h‡ = gsw_dynamic_enthalpy
hO = h - h‡ [my two cents worth]
III. How Not To Search For Ocean Heat Content
The simple approach has not generally been followed in scientific papers when the authors are researching and reporting on the thermodynamics of seawater.
For an example, a recent paper measured atmospheric characteristics ("the air") ostensibly to determine ocean heat content (On Resplandy Et Alia (2018), 2).
Some less egregious, but nevertheless the long way home examples, are:
"The projected ocean heat uptake (OHU, i.e., the increase in ocean heat content) in model simulations with an increasing CO2 content has a distinct regional structure. We analyse this for the CMIP3 SRES A1B scenario, for which we have the largest number of models available. For comparison, the same analysis for the 1% CO2 runs of CMIP3 and CMIP5 can be found in the auxiliary material. They show generally less heat uptake because ∫F dt is smaller, but the geographical features are similar." (Ocean heat uptake and its consequences for the magnitude of sea level rise and climate change, cf Study Evaluates Efficiency of Oceans as Heat Sink, Gas Sponge).The basic error, IMO, which these papers exhibit is to ignore "the world according to measurements" and TEOS-10.
"Conduction, Convection, and Radiation
Oceans are critically important in the movement of heat over the planet. In elementary school you learned that heat moves by conduction, convection, and radiation. Radiation and conduction are effective in moving heat vertically from the earth's surface, but are relatively unimportant in moving heat horizontally. Water, like air, is a fluid that can carry heat as it moves from one place to another. Meteorologists have different terms for horizontal and vertical movement of fluids: movement in the vertical direction driven by buoyancy is called convection, and movement in the horizontal direction is called advection. Convection contributes, with radiation and conduction, to the movement of heat in the vertical direction. But advection is essentially the sole process by which heat moves laterally over the surface of the earth.
...
Water Transport of Heat
Water is about 1,000 times as dense as air, and, since the amount of thermal energy transported by a moving fluid is proportional to its density, a volume of water can transport about a thousand times as much heat as an equivalent volume of air. The rate at which heat is transported, called the heat flux, is measured in Joules of energy per unit area per unit time, so the rate at which heat is transported is also proportional to the speed of movement (wind speed in air or current speed in the ocean). Since wind speed is typically on the order of 10 meters per second and ocean drift currents on the order of centimeters per second, the air speed is about a thousand times larger than ocean speed. Therefore, air moves a thousand times faster than water but carries only about 1/1000 as much heat per unit volume, which suggests that water is approximately of equal importance to air in moving heat over the planet." (Ocean Structure and Circulation).
I mean ignoring in situ measurements taken and thereafter processed using the official thermodynamics toolbox, relying instead on "old timey" models and assumed data values.
That is why I ask: "Where da measurements at?"
 |
| Fig. 3a |
 |
| Fig. 3b |
 |
| Fig. 3c |
 |
| Fig. 3d |
 |
| Fig. 3e |
IV. How To Search For Ocean Heat Content
In the previous two posts of this series we looked at the mean average of actual heat content values (hO) of the seawater.
Those values are expressed in terms of Joules per kilogram (J / kg), but today we take a new look by calculating only the mean average change in heat content that is taking place annually (still using J / kg of course).
Using the TEOS-10 toolkit, that new look simply means graphing an increase or a decrease in heat content per mass unit of seawater at various depths (Fig. 2) in various latitude bands (Fig. 1) across the oceans of the globe.
This means that today we are not graphing the actual values, instead, we are graphing the change in actual values from one year to the next.
That allows us to track "heat" that is driven by the laws of thermodynamics as that heat radiates through the ocean depths.
V. The Graphs Generally
As was done in the previous posts in this series, the layers marked with blue squares at Fig. 1 are the specific layers we are examining.
The graph values all start at zero change for the first measurement, then increase or decrease as TEOS-10 functions determine the heat content changes (Section II above).
Changes in heat content show that over time heat has radiated into or radiated out from seawater at various depths at those latitude band locations.
Furthermore, the graphs which show the Hadopelagic depth changes inform us that the heat content changes are radiating all the way down to the deepest depths.
Even though the deepest depth regions have not been measured as extensively (to say the least) as the upper depth levels have been, we can still see that heat content change reaches down to the deepest depths.
It is worthwhile to know that the in situ measurements processed into TEOS-10 values show that the heat content down there, like the depth levels above it, is also in flux.
Assuming that you have built your system, constructing the heat flux graphs only involves:
1) selecting a year to begin with,The graphs will leave a "fingerprint" of the heat flux over the span of the years chosen to be graphed and studied.
2) setting the begin-year initial change value to zero,
3) recording that initial value, and thereafter
4) subtracting that initial value from each following year's value,
5) graphing the change in heat content for each year.
VI. The Graphs: Specifically
A. Fig. 3a
The graph at Fig. 3a details the changes in potential enthalpy (hO), a.k.a. "heat content" and heat flux at WOD Layer 0 (Arctic seawater, see graph Fig. 3a here).
The sequence begins circa 1950 with a change value of zero J / kg.
Then the fun begins as we examine the fingerprints of the culprit we call "the heat" for the following years.
At this layer over this span of about 70 years, heat content decreases at the Epipelagic and Mesopelagic depth levels, but increases at the Bathypelagic depth level.
In other words the heat is obeying the 2nd law of thermodynamics (heat spontaneously flows to cold).
B. Fig. 3b
This layer 4 is at the latitude that crosses portions of the USA, Europe, and China.
The latitude layers away from the poles tend to have deeper waters, so we even have some Hadopelagic measurements and values at WOD Layer 4.
Comparing this change in heat content with the actual heat content graphs shows how the heat flux graphs tell us even more about heat content dynamics in the oceans (see graph Fig. 3b here).
A point to take note of is that each downward direction on each graph line tells us that heat radiated out of seawater at that level, while each upward direction on each graph line tells us that heat radiated into the seawater at that level.
So, we have direct evidence of heat flux into and out of seawater at all depths of the ocean along this latitude.
I noticed that, counter intuitively, the deepest level, the Hadopelagic, had more heat flux at times than shallower levels had.
This is a good time to remember that heat flux can be greater in one depth level even though that depth level can at the same time have less actual heat content than that other level which had more heat flux (i.e. the amount of change in potential enthalpy (hO) does not ipso facto indicate the total amount of potential enthalpy (hO) contained in that particular mass unit of seawater).
C. Fig. 3c
This WOD layer 8 has one boundary we call the Equator (latitude 0).
The heat flux here is also "at odds" with the total heat content (see graph Fig. 3c here).
D. Fig. 3d
The latitude of WOD Layer 12 crosses Australia (etc.).
The ocean at that latitude has some Hadopelagic depths.
An interesting tidbit is that its Epipelagic level has the most heat flux at times, indicating either heat flux radiating down from solar energy or radiating up from a sometimes warmer Mesopelagic level.
One case in point is the year 1997 where the Mesopelagic level just under it (red line) has a severe decrease in heat content when the Epipelagic had a sharp increase (compare Fig. 3d here).
The gist of heat flux, in terms of graph lines, is that when the line dips downward heat content at that level has radiated to another level, and when the graph line turns upward, it indicates some heat content from another level has radiated into that level.
In all cases, the radiation can come from below or from above, whether the change is an increase or a decrease.
E. Fig. 3e
This is WOD Layer 16 which circles Antarctica.
The greatest current on Earth flows in this layer, containing more flow of seawater than the fresh water flow in all of the Earth's great land-based rivers combined.
Like the Arctic, it does not have the Hadopelagic depth level.
It has some of the other characteristics of the Arctic, in that the deeper depths tend to show increases in heat flux in recent years.
Also, the heat content at the surface varies with heat flux (see Fig. 3e here).
VII. Conclusion
Heat flux means a change in heat content in a mass unit of seawater.
Graphs of actual heat content (hO, potential enthalpy) do not show heat flux as clearly as change in hO graphs used along with them do.
Using both together produces the best results, because both used together offer substantial support for a better understanding of heat content vs heat flux in all of the ocean basins (cf. Patterns: Conservative Temperature & Potential Enthalpy).
The next post in this series is here, the previous post in this series is here.
Must we? ...