Saturday, February 10, 2018

Hot, Warm, & Cold Thermal Facts: Tidewater-Glaciers - 2

Fig. 1 Totten Glacier Neighborhood
I. Background

This series deals with deceitful doublespeak used to misinform the public about where they really are (You Are Here, 2, 3, 4, 5, 6).

We are told that Antarctica is so mysterious we have to look backwards a zillion and a half years to know what it will be like on the fourth of July next, but just looking at recent evidence is of no moment (The Ghost-Water Constant - 9).

Those who have read the textbooks created in the "it can't happen here age" will tend to still be thinking that it can't happen here (The Case for a Stable East Antarctic Ice Sheet: The Background).

Since reality is difficult to hide from competent scientists, the dire straits near Totten Glacier are now getting to be a hot item to study (Newsweek, Science Mag).

Fig. 2a WOD Zone 3612
Fig. 2b Another Way To Look At It
As I explained in the previous post in this series, I ran across some SOCCOM data that focuses on the Southern Ocean (Hot, Warm, & Cold Thermal Facts: Tidewater-Glaciers).
Fig. 3a
Fig. 3b
Fig. 3c
Fig. 3d
Fig. 3e
Fig. 3f

I downloaded it and turned the TEOS-10 toolkit loose on it.

Today, let's look at Totten Glacier through those TEOS-10 eyes.

II. Back To Reality At Totten

The graphs at Fig. 1 and Fig. 2a - Fig. 2b give a picture of where Totten Glacier is located.

Conventional lack of wisdom misinforms us that since Totten and its ilk are far away and stable, so "nothing to see here folks, move along and go shopping."

Besides, it takes really, really warm or hot water to melt glaciers like Totten, so there is nothing to be concerned about.

Or, as the Preznit says, "Jiner thought up climate change so they could have bigly military parades."

III. Graphed Melt At Totten

As the eyes of TEOS-10 inform us, we have not yet warmed up to the cold reality of glacial melt at the grounding line and above it.

The graphs at Fig. 3a - Fig. 3f detail the melting points of the ice at the face of the Totten tidewater glacier.

The water that is melting that ice, and has been for over a hundred years, is deadly cold, but not as cold as it once was.

Atmospheric Ice Sheet Melt started a couple of decades or so after the industrial revolution began circa 1750 (see e.g. Weekend Rebel Science Excursion - 54, Questionable "Scientific" Papers - 3).

IV. More About The Graphs

Notice that the temperature, salinity, and depth / pressure determine melt conditions.

Also notice that the seawater doing the melting is extremely cold, BUT, it is not as cold as the ice is because "three-quarters of that [ocean] heat uptake [from global warming] occurs in the Southern Ocean" (Antarctica 2.0 - 3).

So, obeying the second law of thermodynamics, the less-cold stuff in the seawater flows into the more-cold glacier ice stuff, and when that dynamic is fully complete, we have very cold melt water.

I graphed the WOD Zones at and around Totten Glacier (WOD Zones 3611, 3612, and 3613) after applying the TEOS-10 toolkit to them.

The data in the WOD was not as robust as it is in other areas, so the SOCCOM data carried the day.

You can see that the temperatures vary with depth, as does salinity and pressure (measured in dbars).

V. The Bad News

Obviously it is not good news that it does not take much heat-transfer, under proper thermodynamic conditions, to melt glacial ice at or near the grounding line.

However, stopping the melting dynamic means stopping fossil fuel use and thereafter waiting an unknown amount of time for the ocean to "cool off" back to normal.

In the mean time the sea level will continue to rise until the melt stops.

VI. Conclusion

Science is only good for society when society heeds the "heads up" that science provides.

The next post in this series is here, the previous post in this series is here.


Friday, February 9, 2018

Antarctica 2.0 - 3

Fig. 1 Southern Ocean - SOCCOM
This series has dealt with a concern I have had about the history of Antarctica we have read in textbooks.

It is a concern that government has been "intentionally unaware" of the ice down under (Antarctica 2.0, 2).

Antarctica has been a place shrouded in a mystery manufactured by Oil-Qaeda (Humble Oil-Qaeda).

In terms of geographical reality Antarctica is the place surrounded by the Southern Ocean (Fig. 1).

An ocean that should never have been ignored:
"The vast Southern Ocean, which surrounds Antarctica, plays a starring role in the future of climate change. The global oceans together absorb over 90 percent of the excess heat in the climate system and roughly three-quarters of that heat uptake occurs in the Southern Ocean. In addition, the global oceans absorb around 25 percent of anthropogenic carbon dioxide emissions and the Southern Ocean alone accounts for about half of the uptake of CO2.

Despite its critical role in our climate system, the Southern Ocean has gone almost completely unobserved. Scientists have struggled to gather precise measurements because of the harsh environment and extreme remoteness. The changing dynamics of the Southern Ocean will in turn drive key aspects of our future climate, including how sensitive the Earth will be to further warming and increases in carbon dioxide emissions. As a result, improved observations are crucial to helping scientists understand and predict how our climate will change."
(Climate Central, emphasis added). So, when we were ignoring the Southern Ocean and the vast continent of ice in the middle of it, we were ignoring seventy-five percent (75%) of the threat to civilization itself (Why Sea Level Rise May Be The Greatest Threat To Civilization, 2, 3, 4, 5).

Thus, Civilization Is Now On Suicide Watch, 2, 3, 4, 5, 6, 7, 8 as the government wants to celebrate (Trump’s ‘marching orders’ to the Pentagon: "Plan a grand military parade") while the infection is metastasizing (Trump Supporters Consume And Share The Most Fake News, Oxford Study Finds).

I discovered an additional database of salinity, temperature, and depth measurements that are very up to date (SOCCOM).

I have downloaded them, which added over 3.4 million in situ measurements to my World Ocean Database (WOD) collection.

I now have over 1.2 billion in situ measurements in that database.

I will present graphs and data in upcoming posts.

Meanwhile, if you haven't already, check out the links to SOCCOM (Fig. 1).

The next post in this series is here, the previous post in this series is here.

A message from the Heart of the Antarctic Ice Sheet to Civilization:

If we still have time, we might still get by
Every time I think about it, I want to cry
With bombs and the devil, and the kids keep comin'
No way to breathe easy, no time to be young
But I tell myself that I was doin' all right
There's nothin' left to do at night
But go crazy on you
Crazy on you
Let me go crazy, crazy on you, oh
My love is the evenin' breeze touchin' your skin
The gentle, sweet singin' of leaves in the wind
The whisper that calls after you in the night
And kisses your ear in the early moonlight
And you don't need to wonder, you're doing fine
My love, the pleasure's mine
Let me go crazy on ya
Crazy on you
Let me go crazy, crazy on you, ohhh
Wild man's world is cryin' in pain
What you gonna do when everybody's insane
So afraid…


Tuesday, February 6, 2018

Hot, Warm, & Cold Thermal Facts: Tidewater-Glaciers

Fig. 1 Is this a "Hot Glacier?"
I. Background

Regular readers know that I have had my eyes on ice sheets, ice shelves, and glaciers for some time now.

Recently, while reading Thermodynamic Equation Of Seawater - 2010 (TEOS-10) manuals, it dawned on me that I could use the toolkit (along with World Ocean Database (WOD) in situ measurements) to take a look at what water temperatures were melting ice sheet glaciers that had made their way to the ocean.

As you know, those tongues of ice-sheet ice-streams eventually branch out into glaciers, which are called tidewater glaciers when they flow into the oceans and then interface with seawater (Water terminating glaciers, Related, Frontal Melting @ Tidewater Glaciers, Cryosphere Frontal Melting).
Fig. 2 Tidewater Glacier Areas

A favorite area of inquiry, when taking a look at those glaciers, is the "grounding line" area (Grounding Lines, Convection-Driven Melting near the Grounding Lines).

When I read that ocean water temperature was paramount, I decided to go all in to check it out (Ocean temperatures dictate glacier calving).

Adding to that was some rhetoric I came across that categorized glaciers with a puzzling description of: Cold, Temperate, or Polythermal (Thermodynamics of Glaciers).

Excuse me for having thought all along that glaciers were all cold ("hot" or "warm" glaciers anyone?).

Fig. 3a Antarctica
Fig. 3b Glacier Bay
Fig. 3c Greenland
Fig. 3c Patagonia
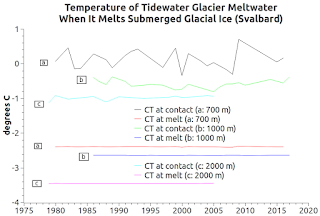
Fig. 3d Svalbard
II. Keyboarding Into Action

I lashed out a bit at the warming commentariat for having used "warm" and "hot" to mislead me (Questionable "Scientific" Papers - 17, On Thermal Expansion & Thermal Contraction - 32).

Now, I am letting regular and irregular readers know that I have completed two new modules that calculate the melting temperatures of glacial ice that is submerged.

One module uses seventy-three individual WOD Zones that are along coastlines where tidewater glaciers are being melted and calved by VERY COLD WATER.

The other module groups zones into "areas" called Glacier Bay, Svalbard, Patagonia, Greenland, and of course Antarctica (e.g. today's graphs).


III. Oh, And Did I Mention The Graphs?

The graphs at Fig. 3a - Fig. 3d feature data the tidewater glacier areas shown on the WOD Zone map at Fig. 2.

The software procedure for determining the Conservative Temperature (CT) of seawater was explained at The Art of Making Thermal Expansion Graphs.

Those graphs at Fig. 3a - Fig. 3d  show the seawater temperature at the two or three top lines, representing "CT at contact".

The bottom two or three lines on those graphs represent "CT at melt."

Let me explain.

Tidewater glaciers are glaciers that have substantial portions submerged under the ocean because they slide from land into the sea.

The depth of the water at the "CT at contact" is 700 meters, 1000 meters, and 2000 meters, as is the "CT at melt".

The thermodynamic circumstance which determines the melting point in any give case is CT (degrees C), Absolute Salinity (SA) in g/kg, and Pressure (P) in dbars at that depth.

The CT is just above the freezing point of seawater in that circumstance, after the melt.

The way it happens is that the second law of thermodynamics is in play.

Simply put, an area of water with a CT above the ice CT it comes in contact with will experience a transfer of CT from itself to the ice and they both will end up with a state of equilibrium (an equal CT).
Fig. 4 Example melt

Imagine arrows flowing from the top lines, as the CT diminishes, down to the bottom lines (down to the ice as it disintegrates into seawater).

They become one (Fig. 4).

At that point different things happen, depending on the in situ circumstances.

The main thing I want to point out in today's post is the deadly cold temperature of the seawater and of the ice (even after the melt takes place).

IV. TEOS-10 Functions

Now, I will describe the thermodynamics taking place, and show the TEOS-10 functions used to calculate the sequence of events:

Gather: World Ocean Database (WOD) in situ values:

1)  "T" (in situ seawater temperature),
2) "SP" (in situ practical salinity), and
3) "height" (a.k.a. depth) @ "latitude" ...

Determine:

4) "Z" (from in situ depth @ latitude: gsw_z_from_p).
5) "P" (pressure: gsw_p_from_z),
6) "SA" (Absolute Salinity: gsw_sa_from_sp),
7) "CT" (Conservative Temperature: gsw_ct_from_t, which makes the a,b, and c lines at the top of the graphs).
8) "t_ih" (the freezing CT of sea water per in situ conditions: gsw_t_freezing_exact),
9) "w_ih" (the ice fraction: gsw_ice_fraction_to_freeze_seawater)
10) "sa_freeze", "ct_freeze", "w_ih_final" (when "w_ih_final" is zero after executing gsw_melting_ice_into_seawater, then "ct_freeze" is the lowest the temperature of the result of the ice having melted into the seawater can be ("Note that when w_Ih_final = 0, the final seawater is not at the freezing temperature." - TEOS-10 source code comment).

This makes the a,b,and c lines at the bottom of the Fig. 3a - Fig. 3d graphs).

V. Conclusion

A couple of decades after the industrial revolution (which began circa 1750), the glaciers and ice sheets began to melt above sea level.

Eventually they also began to melt below sea level as in situ temperatures increased (Weekend Rebel Science Excursion - 54, Questionable "Scientific" Papers - 3).

The thermodynamic properties I am studying give new meaning to "warm" water that melts ice doesn't it?

The next post in this series is here.