The previous post in this series featured latitude "layers" (a horizontal look at variations in ocean water characteristics along latitude bands).
In today's post, the graphs of TEOS-10 concepts Conservative Temperature, Absolute Salinity, and Thermal Expansion and Contraction are provided for several Ocean areas on an ocean by ocean basis.
They are mean averages of the zones of one ocean area, whereas the layered approach contains zones from different oceans at some locations.
The Southern ocean data will not be the same as the lines in layers 14 and 15 in the previous post's layered approach
III. Same Results
The resulting principles are the same however, which is that thermosteric sea level change is not the major cause of sea level rise, nor is it even a major cause.
The previous post has links to more details about thermal expansion and contraction.
But the basic exercise is to calculate the mass/volume of a depth level, each one of the 33 individual slices of the total WOD Zone, then calculate the expansion and contraction of that slice (length x width x height = volume).
Then apply the temperature changes and thermal expansion coefficient to each volume slice.
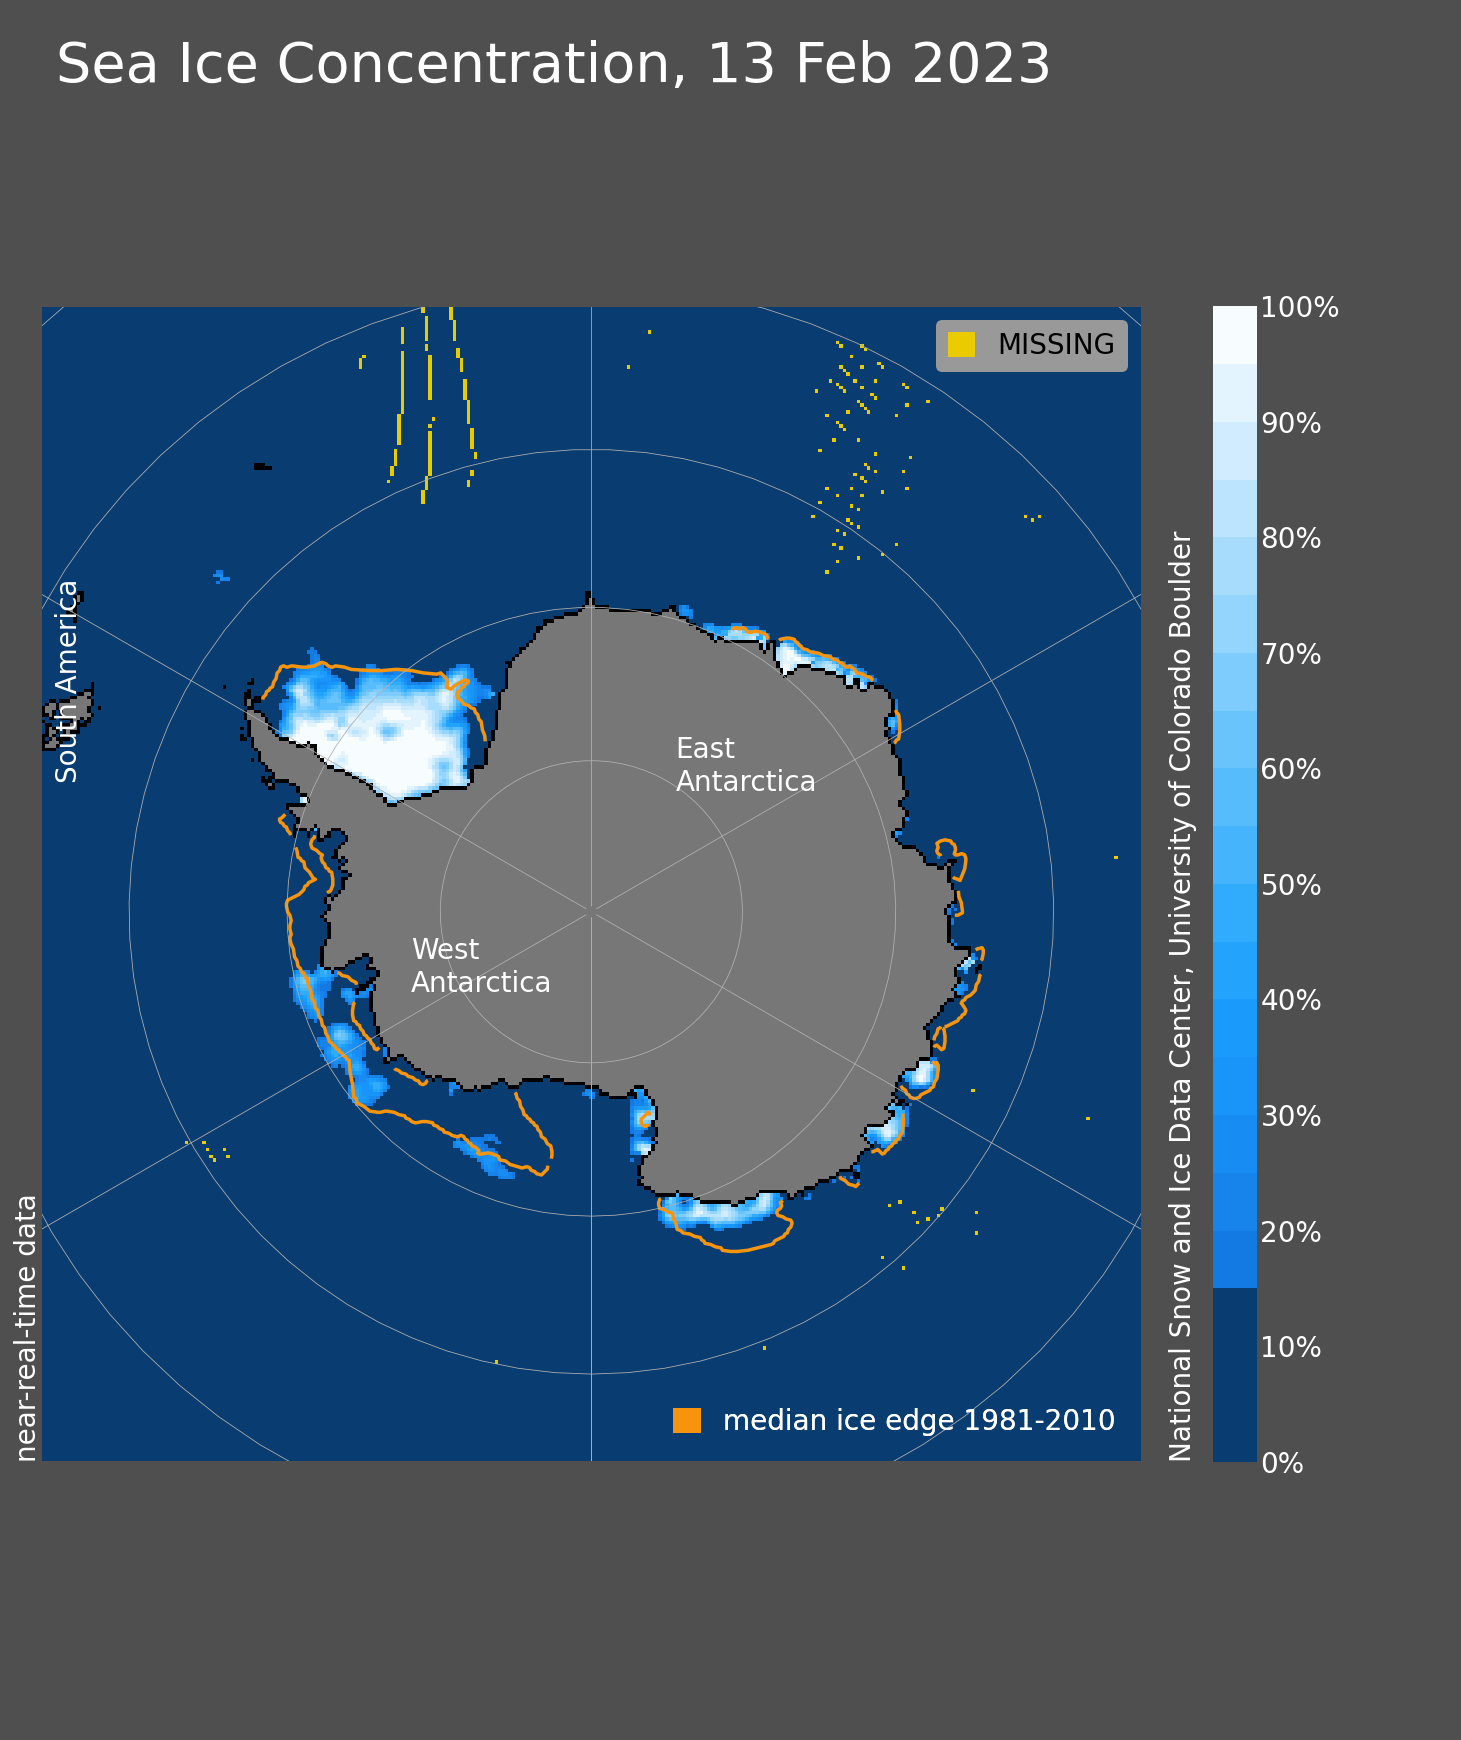
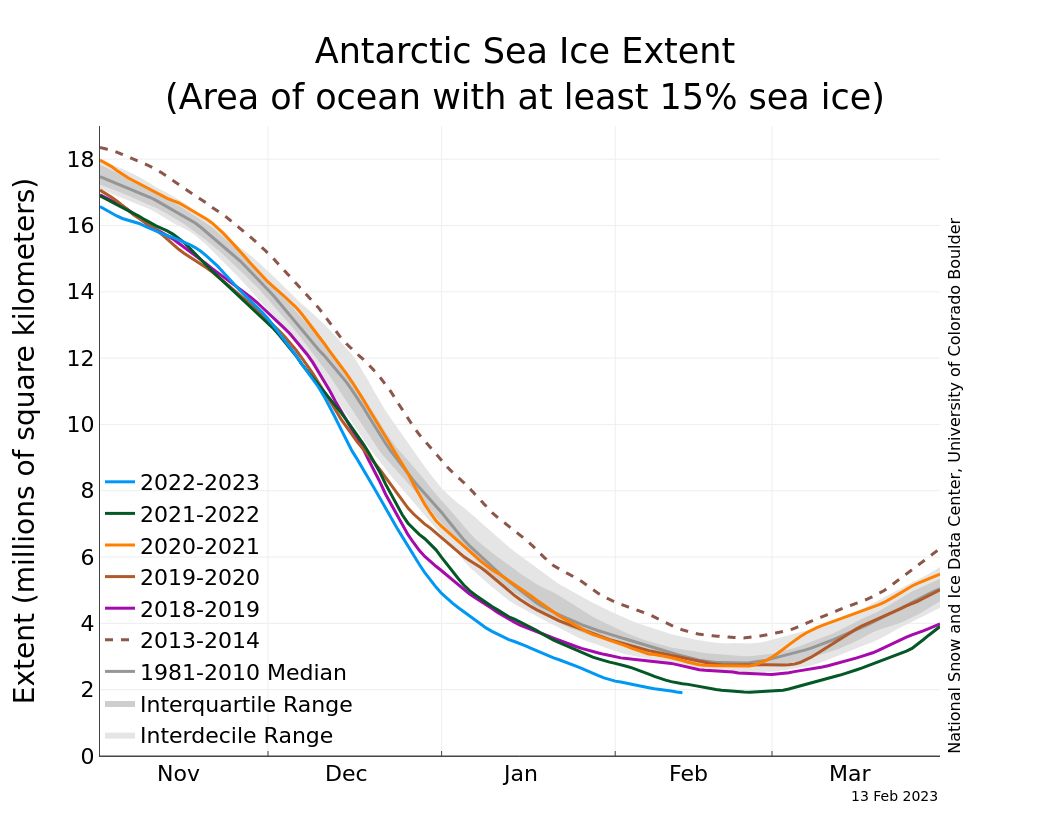
Repeat often because change is real (Sea Ice Today).
The 11 red lines (0m to 300m; h=300) on the graphs depict sea water charisteristics at the following depths:
"0m down to 10m", "11m down to 20m", "21m down to 30m", "31m down to 50m", "51m down to 75m", "76m down to 100m", "101m down to 125m", "126m down to 150m", "151m down to 200m", "201m down to 250m", "251m down to 300m"
II. Blue Lines
The 11 blue lines (400m to 1400m; h=1100) on the graphs depict sea water charisteristics at the following depths:
"301m down to 400m", "401m down to 500m", "501m down to 600m", "601m down to 700m", "701m down to 800m", "801m down to 900m", "901m down to 1000m", "1001m down to 1100m", "1101m down to 1200m", "1201m down to 1300m", "1301m down to 1400m"
III. Cyan Lines
The 11 cyan lines (1500 to 5500m; h=4000+) on the graphs depict sea water charisteristics at the following depth levels:
"1401m down to 1500m", "1501m down to 1750m", "1751m down to 2000m", "2001m down to 2500m", "2501m down to 3000m", "3001m down to 3500m", "3501m down to 4000m", "4001m down to 4500m", "4501m down to 5000m", "5001m down to 5500m", "5501m down to the bottom"
Antarctic sea ice extent appears to have broken the record low set last year. With a couple more weeks likely left in the melt season, the extent is expected to drop further before reaching its annual minimum. Much of the Antarctic coast is ice free, exposing the ice shelves that fringe the ice sheet to wave action and warmer conditions.
Overview of conditions
Figure 1a. This map of Antarctica shows many low areas of sea ice concentration, depicted as darker blues, surrounding the continent, rendering extent likely to decrease in the coming days or weeks. Antarctic sea ice extent for February 13, 2023, was 1.91 million square kilometers (737,000 square miles). The orange line shows the 1981 to 2010 median extent for that day. Sea Ice Index data. About the data
Figure 1b. The graph above shows Antarctic sea ice extent as of February 13, 2023, along with daily ice extent data for four previous years and the record high year. 2022 to 2023 is shown in blue, 2021 to 2022 in green, 2020 to 2021 in orange, 2019 to 2020 in brown, 2018 to 2019 in magenta,and 2013 to 2014 in dashed brown. The 1981 to 2010 median is in dark gray. The gray areas around the median line show the interquartile and interdecile ranges of the data. Sea Ice Index data.
On February 13, 2023, Antarctic sea ice extent fell to 1.91 million square kilometers (737,000 square miles) (Figure 1a). This set a new record low, dropping below the previous record of 1.92 million square kilometers (741,000 square miles) set on February 25, 2022 (Figure 1b). This year represents only the second year that Antarctic extent has fallen below 2 million square kilometers (772,000 square miles). In past years, the annual minimum has occurred between February 18 and March 3, so further decline is expected.
Conditions in context
Figure 2. This graph shows Antarctic annual sea ice minimum extent, depicted as black diamonds, from 1979 to 2023, based on a 5-day running average of daily extent. The grey diamond data point depicts the 2023 minimum, which is still preliminary, with further loss expected. The linear trend line is in blue with a 0.9 percent per decade downward trend, which is not statistically significant. A five-year running average is shown in red. As the Antarctic melt season is still in progress, depicted as a grey downward arrow, the linear trend and running average will change slightly.
Extent has tracked well below last year’s melt season levels since mid-December. As noted in our previous post, a positive Southern Annular Mode has led to stronger-than-average westerly winds. Along with a strong Amundsen Sea Low, the weather conditions have brought warm air to the region on both sides of the Antarctic Peninsula. This has largely cleared out the ice cover in the Amundsen and Bellingshausen Seas, and reduced the sea ice extent in the northwestern Weddell Sea. Sea ice is patchy and nearly absent over a long stretch of the Pacific-facing coastline of Antarctica. Earlier studies have linked low sea ice cover with wave-induced stresses on the floating ice shelves that hem the continent, leading to break up of weaker areas.
Antarctic sea ice extent has been highly variable over the last several years. While 2022 and 2023 have had record low minimum extent, four out of the five highest minimums have occurred since 2008. Overall, the trend in Antarctic minimum extent over 1979 to 2023 is near zero. The current downward linear trend in the Antarctic minimum extent from 1979 to 2023 is 2,400 square kilometers (930 square miles) per year, or 0.9 percent per decade, which is currently not statistically significant. Nevertheless, the sharp decline in sea ice extent since 2016 has fueled research on potential causes and whether sea ice loss in the Southern Hemisphere is developing a significant downward trend.
The 11 red lines (0m to 300m; h=300) on the graphs depict sea water charisteristics at the following depths:
"0m down to 10m", "11m down to 20m", "21m down to 30m", "31m down to 50m", "51m down to 75m", "76m down to 100m", "101m down to 125m", "126m down to 150m", "151m down to 200m", "201m down to 250m", "251m down to 300m"
II. Blue Lines
The 11 blue lines (400m to 1400m; h=1100) on the graphs depict sea water charisteristics at the following depths:
"301m down to 400m", "401m down to 500m", "501m down to 600m", "601m down to 700m", "701m down to 800m", "801m down to 900m", "901m down to 1000m", "1001m down to 1100m", "1101m down to 1200m", "1201m down to 1300m", "1301m down to 1400m"
III. Cyan Lines
The 11 cyan lines (1500 to 5500m; h=4000+) on the graphs depict sea water charisteristics at the following depth levels:
"1401m down to 1500m", "1501m down to 1750m", "1751m down to 2000m", "2001m down to 2500m", "2501m down to 3000m", "3001m down to 3500m", "3501m down to 4000m", "4001m down to 4500m", "4501m down to 5000m", "5001m down to 5500m", "5501m down to the bottom"
Some of his work involves increasing the accuracy of calculating the ever changing location of the "grounding line" of tidewater glaciers along the coastline of Antarctica (ibid).
That has been helpful to those who want to do research there, of course, and so we have now reached the obvious:
"Thwaites Glacier is thought to be susceptible to runaway retreat triggered at the grounding line (GL) at which the glacier reaches the ocean. Recent ice-flow acceleration and retreat of the ice front and GL indicate that ice loss will continue."
(Nature 2023, Hetergeneous melting, at 471, emphasis added). Why that is significant is explained on the same page of that paper:
"Offshore ocean and atmospheric conditions force warm circumpolar deep water (CDW) onto the Amundsen Sea continental shelf, where it contributes to ice loss and GL retreat of glaciers draining this sector of the West Antarctic Ice Sheet, including Thwaites Glacier. Thwaites Glacier extends seaward from the Walgreen Coast, forming the Thwaites Glacier Tongue (TGT) to the west and the TEIS that rests on a prominent sea-floor pinning point (Fig. 1a). Warm CDW flows towards the glacier along the coastline and through sea-floor channels, where it drives melting. The bed underneath the upstream grounded ice deepens to a maximum of 2,300 m below sea level, making it susceptible to large-scale retreat from ocean-driven melting. Collapse of Thwaites Glacier, which itself represents more than half a metre of global sea-level-rise potential, could also destabilize neighbouring glaciers that account for a further 3m of future sea level rise."
(ibid p. 471, emphasis added). Ice shelf (not ice sheet) melt also is impacted:
"The rate of ice-shelf mass loss has increased by 70% between 1994 and 2012, precipitating a shift towards faster drainage of grounded
ice into the ocean. Several major grounding lines in the Amundsen Sea sector have retreated rapidly inland, raising the possibility of an unstable collapse of the WAIS. Nowhere are these processes more apparent and potentially serious than at Thwaites Glacier, which drains about 10% of the WAIS. Thwaites is largely grounded below sea level on a retrograde bed 4 (that is, a bed that deepens inland) and is particularly susceptible to marine ice-sheet instabilities. Its grounding line has retreated 14 km inland since the late 1990s and, in some regions, is retreating by up to 1.2 km per year at present."
(Nature 2023, Suppressed basal melting, at 479, emphasis added). This same likelihood exists at various and sundry locations all around the glacial bases all around the ~58,000 km of grounding lines along the coast of the continent of Antarctica.
III. New
The Southern Ocean around Antarctica was only recently officially recognized (New Ocean), but the scientific models still don't recognize it:
"Models of ocean forcing are often limited by resolution or available parameterizations. Generally, models represent ice shelves simplistically as wedges of ice with flat or curved interfaces and an inferred sea-floor geometry as a function of distance from the presumed GL. Usually a zero-melt condition is imposed at the GL, which is inconsistent with evidence of thinning and GL retreat. Although retrograde bed slopes facilitate positive feedback in grounded ice loss from ocean-forced melt, glaciers resting on prograde slopes still face influence from warm water undercutting the ice."
(ibid p. 471). Dredd Blog has pointed out in various and sundry ways that the science of Oceanography needs to enter the quantum physics age where photons really do exist (Quantum Oceanography, 2, 3, 4, 5, 6, 7, 8, 9, 10, 11, 12, 13, 14, 15, 16).
IV. Parting Ways
Where I part ways with the two papers is when they mention "a thousand years" within a inference of "nothing to see here folks, move along."
The scientist who warned congress on related matters in 1988 (3 and a half decades ago) was aware of that phenomenon and wrote a paper laying it all out:
"I suggest that a 'scientific reticence' is inhibiting the communication of a threat of a potentially large sea level rise. Delay is dangerous because of system inertias that could create a situation with future sea level changes out of our control. I argue for calling together a panel of scientific leaders to hear evidence and issue a
prompt plain-written report on current understanding of the sea level change issue."
(Scientific Reticence, Hansen). The reason I take issue with how long it will take for Antarctica to melt is that it is utterly irrelevant.
What matters is how long will it take for a tiny, tiny portion of the Cryosphere (1.14%) or of Antarctica (1.25%) to melt to do substantial damage to civilization as we know it (The Extinction of Robust Sea Ports, 2, 3, 4, 5, 6, 7, 8, 9, 10, 11, 12, 13).