 |
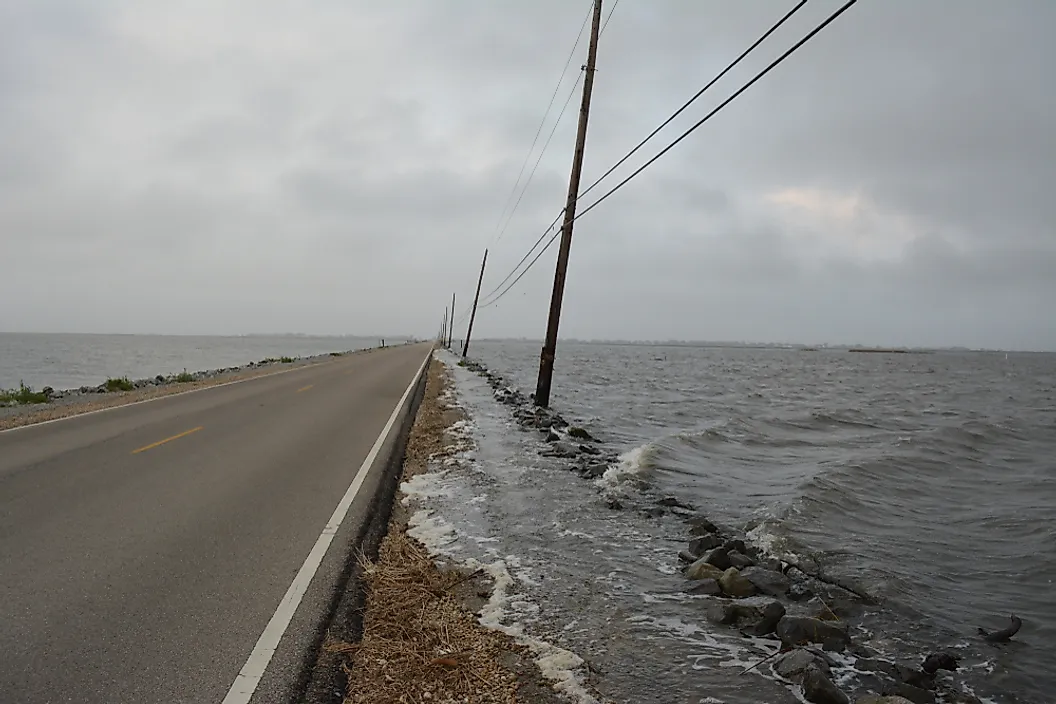
| Louisiana By The Sea |
I. Background
Recently (29 Aug 2022) the PSMSL updated its data sets.
So, in today's post, using that data, I am bringing the Dredd Blog seaport data up to date.
II. Usual Appendices
The usual "Seaports With Sea Level Change" data is listed and linked to in the following table:
| (HTML) Single Coastline Countries | (HTML) Multi Coastline Countries | Coastline Graphs |
| Appendix: A-C | Appendix: A-C | Appendix: A-C |
| Appendix: D-G | Appendix: D-G | Appendix: D-G |
| Appendix: H-L | Appendix: H-L | Appendix: H-L |
| Appendix: M-O | Appendix: M-O | Appendix: M-O |
| Appendix: P-T | Appendix: P-T | Appendix: P-T |
| Appendix: U-Z | Appendix: U-Z | Appendix: U-Z |
III. Additional Appendices
In addition to that usual data I am also updating the "Seaports With A Foot Or More of Sea Level Change" data first presented in the previous post of this series.
That data is in the updated additional appendices (Appendix SLR, Appendix SLF, and Appendix Ports By Zone) which are also based upon the recent PSMSL updates.
The various appendices can show views of the same data source location (tide gauge station and/or seaport) over various spans of time.
That is the data may have a different beginning and/or ending year, which can result in an apparent sea level data variation.
There is variation over different spans of time because the various Cryosphere locations can and do loose ice at changing rates from year to year.
This causes fluctuations in sea level fall and sea level rise depending on a tide gauge or port's proximity to the Cryosphere location.
IV. Closing Comments
The Dredd Blog general philosophy on sea level change is fundamentally summed up as "there is too little attention paid to the impact sea level change will have on civilization by the threat it presents to sea ports."
So, the effort is make to present the evidence from tide gauge data so that those who care can look into it.
The next post in this series is here, the previous post in this series is here.


