 |
| Fig 1 World Ocean Database |
In the previous posts in this series the number of measurements of ocean temperatures at a few locations were featured.
In this post the appendix contains many more locations and many more counts.
For example, only portions of the Atlantic and Pacific oceans were featured in the previous post; and in the first post of this series the "layers" used included a mixture of many segments of oceans because it was done on a latitude basis (a latitude based layer circles the globe and includes segments of several oceans).
There is nothing wrong with looking at it that way, but the more ways in which we consider these things the more likely we are to discover something useful.
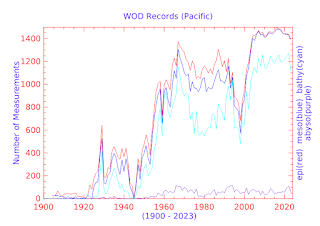
In today's post and appendix the relevant WOD Zones (Fig. 1) are specified for each area of the ocean that is featured in terms of the number of measurements made in that ocean area.
The data featured begins in the year 1900 and continues until the year 2023.
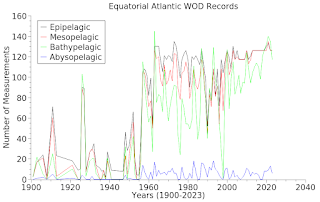
The emphasis is to show that the deepest layer, the Hadopelagic depth, is not well represented in our history of ocean measuring records.
But more than that, we can also see how the ups and downs of measurement research based on ocean temperature taking significantly varies over time.
So, in the Appendix GR2 the measurements in the following WOD Zones in the listed ocean areas were counted:
Atlantic:
7606 7605 7604 7603 7602 7601 7600 7506 7505 7504 7503 7502 7501 7500 7407 7406 7405 7404 7403 7402 7401 7400 7309 7308 7307 7306 7305 7304 7303 7302 7301 7300 7209 7208 7207 7206 7205 7204 7203 7202 7201 7200 7108 7107 7106 7105 7104 7103 7102 7101 1600 1601 1500] [7006 7005 7004 7003 7002 7001 7000 1000 5004 5003 5002 5001 5000 3000 3001] [5103 5102 5101 5100 3100 3101 5205 5204 5203 5202 5201 5200 3200 3201 5306 5305 5304 5303 5302 5301 5300 3300 3301 3302 5406 5405 5404 5403 5402 5401 5400 3400 3401 3402]
Pacific:
1615 1616 1617 7617 7616 7615 7614 7613 7612 7611 7610 1513 1514 1515 1516 1517 7517 7516 7515 7514 7513 7512 1412 1413 1414 1415 1416 1417 7417 7416 7415 7414 7413 7412 1311 1312 1313 1314 13151316 1317 7317 7316 7315 7314 7313 7312 7311 1210 1211 1212 1213 1214 1215 1216 1217 7217 7216 7215 7214 7213 7212 7211 7210 1110 1111 1112 1113 1114 1115 1116 1117 7117 7116 7115 7114 7113 7112 7111 7110 7109] [1008 1009 1010 1011 1012 1013 1014 1015 1016 1017 7017 7016 7015 7014 7013 7012 7011 7010 7009 7008 7007 3008 3009 3010 3011 3012 3013 3014 3015 3016 3017 5017 5016 5015 5014 5013 5012 5011 5010 5009 5008 5007] [3113 3114 3115 3116 3117 5117 5116 5115 5114 5113 5112 5111 5110 5109 5108 5107 3214 3215 3216 3217 5217 5216 5215 5214 5213 5212 5211 5210 5209 5208 5207 3315 3316 3317 5317 5316 5315 5314 5313 5312 5311 5310 5309 5308 5307 3415 3416 3417 5417 5416 5415 5414 5413 5412 5411 5410 5409 5408 5407] [1416]
Fig. 2 All Oceans
Indian:
1108 1109 1208 1209] [1004 1005 1006 1007 3003 3004 3005 3006 3007] [3103 3104 3105 3106 3107 3108 3109 3110 3111 3112 3203 3204 3205 3206 3207 3208 3209 3210 3211 3303 3304 3305 3306 3307 3308 3309 3310 3311 3312 3313 3314 3403 3404 3405 3406 3407 3408 3409 3410 3411 3412 3413 3414]
Southern:
3503 3504 3505 3506 3507 3508 3509 3510 3511 3512 3513 3514 3515 3516 3517 5517 5516 5515 5514 5513 5512 5511 5510 5509 5508 5507 5506 5505 5504 5503 5502 5501 5500 3500 3501 3502 3603 3604 3605 3606 3607 3608 3609 3610 3611 3612 3613 3614 3615 3616 3617 5617 5616 5615 5614 5613 5612 5611 5610 5609 5608 5607 5606 5605 5604 5603 5602 5601 5600 3600 3601 3602 3706 3707 3708 3709 3710 3711 3716 3717 5717 5716 5715 5714 5713 5712 5711 5710 5709 5708 5707 5706 5705 5704 5703 5702 5701 5700 3700 3701 3702 5816]
Arctic:
1803 1804 1805 1806 1807 1808 1809 1810 1811 1812 1813 1814 1815 1816 1817 7817 7816 7815 7814 7813 7812 7811 7810 7809 7808 7807 7806 7805 7804 7803 7802 7801 7800 1800 1801 1802 1703 1704 1705 1706 1707 1708 1709 1710 1711 1712 1713 1714 1715 1716 1717 7717 7716 7715 7714 7713 7712 7711 7710 7709 7708 7707 7706 7705 7702 7701 7700 1700 1701 1702 1603 1604 1605 1606]
Note that some ocean areas such as smaller "seas" and the like do not have enough measurement data to make graphs without a pretzel effect, so several of them are grouped together then used to acquire enough measurements to make meaningful graphs.
The following miscellaneous ("Misc") groups were composed of the zones listed in each one.
All of the above oceans as well as the following miscellaneous ones are graphed in the Appendix GR2:
Misc_1:
1300 1301 1302 1303 1400 1401 1402 1403] [1304 1305 1404 1405] [1501 1502 1503 1602] [1205] [1203 1204 1103 1104] [1012] [1312]
Misc_2:
1313 1413] [1313] [7609 7608 7607 7509 7508 7507] [1109] [1206 1207] [1108 1208 1209] [7516 7616 7617]
Misc_3:
7107] [7208 7209] [1500] [1212 1213] [1514 1515] [1401]
The graph at Fig. 2 shows the patterns when all WOD measurements in my SQL database are used (notice the drop in measurements during world wars; your guess is as good as mine as to what caused the drop circa the year 2000).
I hope you find the records of ocean temperature taking, presented in this series as mean averages to be as interesting as I do.
I use over 5 billion measurements from WOD, then condense them from WOD depths to pelagic depths, then into mean averages, so the "counts" values presented are still representative of the whole shebang.
The previous post in this series is here.


