Friday, March 8, 2024

The Photon Current - 9

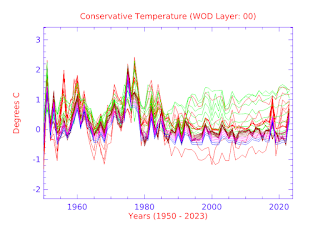
Fig. 1 WOD Layers
I. Background

Temperature is not the only player in the photon current in the oceans, we should also consider salinity change.

Ocean temperature change can cause ocean salinity change (Detection and attribution of Atlantic salinity changes,).

The better way to analyze this is to use TEOS-10 techniques:

"In situ ocean salinity observations are sourced from the World Ocean Database (WOD) downloaded in July 2018 (Boyer et al. 2018), with its quality flags being used to remove spurious data. Data from all available instruments (i.e., Argo, Bottle, CTD) are used in this study. Although salinities are archived in units of Practical Salinity (PSS-78, or psu), Absolute Salinity (SA; g kg−1) is adopted in this study as recommended in the Thermodynamic Equation of Seawater–2010 (TEOS-10) (McDougall et al. 2012)."

(Improved Estimates of Changes in Upper Ocean Salinity and the Hydrological Cycle).

This analysis has to be considered because salt can absorb 'heat' in the form of IR photons:

"A solar power plant in Spain uses salt to store solar energy:

'Near Granada, Spain, more than 28,000 metric tons of salt is now coursing through pipes at the Andasol 1 power plant. That salt will be used to solve a pressing if obvious problem for solar power: What do you do when the sun is not shining and at night?

The answer: store sunlight as heat energy for such a rainy day ... salts ... can be used to store a lot of the sun's energy as heat.'

(Scientific American, How to Use Solar Energy at Night)."

(Quantum Oceanography - 2).

Thus the question arises: "when IR photons are absorbed by atoms in seawater are they absorbed by the atoms in water or the atoms in salt or either one (atoms in water and salt can absorb photons)?".

In previous posts of this series I pointed out that the obvious direction for photons to travel through the vast majority of ocean locations is downward, following the 2nd law of thermodynamics.

While analyzing data I noticed that some of the deeper depths (e.g. 4000-5000+ meter) range showed signs of warming.

I also wondered why this wasn't being noticed in the majority of papers dealing with this issue (not including those that only skim the surface down to about 2000 meters).

While pondering the perplexing problem I noticed that the WOD manual indicates maximum and minimum values for the temperature and salinity of various oceans (WOD manual 2013, Appendix 11.1 - 11.2, p. 132-137).

I decided to check out their temperature assertions for depths where the 'minimum' temperature was below zero degrees Celsius.

I used the TEOS-10 C++ library function 'gsw_ct_freezing' to determine that some of their minimum values are below the freezing point, thus, some valid in situ measurements (above that freezing point) are sure to be rejected (note that the first paper cited above indicated that "with its quality flags being used to remove spurious data"). 

Some of the 'spurious data' was valid.

II. The New Quality Tests

So, I used the WOD estimates for maximum and minimum values for various oceans as a benchmark for rewriting software that was analyzing the WOD data layer by layer.

Today's post has graphs that used that TEOS-10 based revision of the same WOD data that had been used to generate previous graphs.

The differences are colorful, but the exact same number of layers and WOD zones are used.

The number of lines in each depth span is the same too.

III. What Has Changed?

I used the TEOS-10 C++ library function 'gsw_ct_freezing' to determine the Conservative Temperature (McDougal et al. 2023) at which the seawater would freeze.

If the WOD manual minimum was at or below that value, I changed the minimum to that value, and the maximum to that value plus the span between them (the span between them remained the same quantity, the same number of iterations).

What this indicates is that to some degree the warming of the oceans was accidentally covered up by the exclusion of research values below the freezing point, but it does that by only allowing 'through the gate' those in situ measurements in the WOD database which were at or lower than the maximum recorded temperature and were at the manual's minimum  temperature or higher.

In other words, the only thing that changed was which in situ temperature values were included in calculating the average and making the graphs.

But the minimums were no longer the few imaginary values that could not exist in seawater because at the freezing point seawater loses fresh water and becomes seabrine (the amounts of each depending on the degrees below the freezing point).

IV. Comparisons And Closing Comments

Today's appendices (Appendix WOD NFD-1, Appendix WOD NFD-2, Appendix WOD NFD-3) can be compared to those in the previous post (Appendix WOD D-1, Appendix WOD D-2, Appendix WOD D-3).

As you can see, the lower level warming taking place was excluded by the quality control values in the decade-old WOD - 2013 manual (which essentially the same in the 2018 version).

The previous post in this series is here.


It is said that a photon is a boson ...


Appendix WOD NFD-3

This is an appendix to: The Photon Current - 9


Depths are in meters. The following line-colors indicate the depths:

sea level to 250m (red)
251m to 1000m (green)
1001m to 4000m (brown)
4001m to 5500m (orchid)
5501 to bottom (blue)


Appendix WOD NFD-2

This is an appendix to: The Photon Current - 9


Depths are in meters. The following line-colors indicate the depths:

sea level to 250m (red)
251m to 1000m (green)
1001m to 4000m (brown)
4001m to 5500m (orchid)
5501 to bottom (blue)


Appendix WOD NFD-1

This is an appendix to: The Photon Current - 9


Depths are in meters. The following line-colors indicate the depths:

sea level to 250m (red)
251m to 1000m (green)
1001m to 4000m (brown)
4001m to 5500m (orchid)
5501 to bottom (blue)


Psst ... Can You Keep A Secret?

The spies said ...

What will those sitting on the fence between the political yards of candidates Biden and Trump think about this:

"U.S. intelligence agencies plan to provide briefings to former President Donald Trump this year if he secures the Republican presidential nomination, even though he faces federal criminal charges that he mishandled classified information after he left office.

The intelligence community is likely to adhere to past practices for nominees and has no plan to cancel the briefings if Trump becomes the GOP nominee, two sources with knowledge of the matter said. Scrapping the briefings for Trump could open President Joe Biden up to accusations of politicizing access to intelligence, one of the sources said.

Launched by President Harry Truman in 1952, intelligence briefings for presidential nominees are designed to ensure a smooth transition of power and to prepare a prospective commander in chief for office. The briefings are not required by law."

(NBC News: Trump to get intelligence briefings, emphasis added). I won't ask Special Counsel Jack Smith what he thinks about it because he knows the impact it will have on the citizens who plan to vote for Trump (and on Judge Cannon down in Florida).

Anyway, is 'the spoken word' a "document" or "materials" under this law?:

"(a) Whoever, being an officer, employee, contractor, or consultant of the United States, and, by virtue of his office, employment, position, or contract, becomes possessed of documents or materials containing classified information of the United States, knowingly removes such documents or materials without authority and with the intent to retain such documents or materials at an unauthorized location shall be fined under this title or imprisoned for not more than five years, or both.

(b) For purposes of this section, the provision of documents and materials to the Congress shall not constitute an offense under subsection (a).
 
(c) In this section, the term “classified information of the United States” means information originated, owned, or possessed by the United States Government concerning the national defense or foreign relations of the United States that has been determined pursuant to law or Executive order to require protection against unauthorized disclosure in the interests of national security."
 
(18 U.S. Code § 1924).  The question "can you keep a secret" would seem to indicate that the spoken words and those words in the memory of a hearer are "classified information", thus, if someone merely hears "classified information" (not in the form of a paper "document") would it violate the above law?

My hypothesis is that at least this practice will "normalize" (you know ... "the new normal") giving secret classified information to those who have been criminally charged by a grand jury of citizens pursuant to the 5th Amendment ("No person shall be held to answer for a capital, or otherwise infamous crime, unless on a presentment or indictment of a Grand Jury...").

Final question for this post: 
 
Will the lawyers of the accused violator of 18 U.S. Code § 1924 now argue (in the documents criminal case in Federal Court in Florida and elsewhere) that since the intelligence communities don't think that the accused is not so guilty that he need not be kept away from secret "classified information" he's not bad enough to convict?

'No brainer' or 'no biggie'?


Wednesday, March 6, 2024

The Photon Current - 8

Fig. 1 WOD Layers

In the past I have built a database using the World Ocean Database (WOD), but I have in recent years presented that data in a "pelagic depths" average format.

Today, I want to clear up the meaning of the "Hadopelagic" (a.k.a. "Hadal Zone") in terms of the ocean depths involved:

"In most areas, the ocean floor lies 4,000 to 6,000 meters (13,000 to 20,000 feet) below the surface, but deep ocean trenches can extend this depth to 11,000 meters (36,000 feet). The region extending from 6,000 to 11,000 meters is called the hadal, or hadalpelagic, zone after Hades, the Greek god of the underworld. This zone occurs only in trenches; combined across all oceans, they make up an area about the size of Australia."

(Woods Hole Oceanographic Institution, emphasis added; accord: Wikipedia, NOAA). That is not the same as the WOD.

The WOD manual lists 33 standard depth levels which have quality control (maximum, minimum) values for temperature and salinity (I used only those depths because of the quality control values):

"APPENDIX 11. ACCEPTABLE RANGES OF OBSERVED VARIABLES AS A FUNCTION OF DEPTH, BY BASIN

The range values provided has range values for temperature, salinity ... The range values in the tables are used to help identify the most obvious questionable values for these variables. Please note that ranges are given on 33 standard levels (+ one for depths deeper than 5500 m)."
(WOD manual 2013, Appendix 11.1 - 11.2, p. 132-137).

The last level spans 5501 meters deep down to the bottom of the ocean.

In other words, there is a 500 meter variance (6,000 - 5,500 - 500) between the "Hado-" a.k.a. "Hadal-" pelagic depth levels and those quality controlled WOD depth levels.

I have used the average of WOD depth values then converted those into pelagic depth levels in past posts.

So, that 500 meter variation has resulted in 500 meters of the Hadopelagic being included in last quality controlled depth layer WOD  specification.

There was some impact on the calculations at the depths where the two were combined used in terms of averaging.

So, to resolve the 'conflict' from now on I am resorting to the WOD depth levels in graphs instead of the using the pelagic depth values.

This makes the graphs very detailed (33 lines per graph instead of only 5 lines), but once a reader gets used to it there is more detail in the new format.

It also tells a more comprehensive story about what is happening "down under".

Today's graphs are presented in WOD layer format (Fig. 1), including the new depth-level format (Appendix WOD D-1, Appendix WOD D-2, Appendix WOD D-3).

The line-color legend appears at the top of each appendix.

Remember that this series is about currents/streams of ocean heat in the form of infrared (IR) photons.

They travel from 'warmer' atom/molecules (higher IR energy level) to 'cooler' atom/molecules (lower IR energy levels) pursuant to the Second Law of Thermodynamics.

The lines on the graphs represent in situ measurements taken by researchers then sent to the WOD for the use of oceanographers and other interested members of the public.

The next post in this series is here, the previous post in this series is here.


Appendix WOD D-2

This is an appendix to: The Photon Current - 8


Depths are in meters. The following line-colors indicate the depths:

sea level to 250m (red)
251m to 1000m (green)
1001m to 4000m (brown)
4001m to 5500m (orchid)
5501 to bottom (blue)


Appendix WOD D-3

This is an appendix to: The Photon Current - 8


Depths are in meters. The following line-colors indicate the depths:

sea level to 250m (red)
251m to 1000m (green)
1001m to 4000m (brown)
4001m to 5500m (orchid)
5501 to bottom (blue)


Appendix WOD D-1

This is an appendix to: The Photon Current - 8


Depths are in meters. The following line-colors indicate the depths:

sea level to 250m (red)
251m to 1000m (green)
1001m to 4000m (brown)
4001m to 5500m (orchid)
5501 to bottom (blue)