Saturday, December 10, 2016

Global Warming Induced Climate Change Is A Matter of Law - 2

Fig. 1 Is Saturn's Hexagon defying the law?
Once upon a time scientists explored events and described "laws" (e.g. NASA Cassini).

The law of gravity, the laws of thermodynamics, and other natural laws were and still are within their province.

This concept was not altogether alien to the civil laws of cities, states, or nations.

That is known as comity.

As it turns out, one very basic reason for that comity is due to the common sense recognition that law was back then, and still is, a simple matter of sorting out who had or has "the say":
The government of the United States has been emphatically termed a government of laws, and not of men. It will certainly cease to deserve this high appellation if the laws furnish no remedy for the violation of a vested legal right ... It is emphatically the province and duty of the Judicial Department [the judicial branch] to say what the law is.
(Marbury v Madison). That province of the judicial branch of the U.S. Government includes hearing the words and reading the works of professional scientists supplied as facts in various cases:
Based on respected scientific opinion that a well-documented rise in global temperatures and attendant climatological and environmental changes
Fig. 2 Thou shalt not have sharp edges @ 300 mph
have resulted from a significant increase in the atmospheric concentration of “greenhouse gases,” a group of private organizations petitioned the Environmental Protection Agency (EPA) to begin regulating the emissions of four such gases, including carbon dioxide, under §202(a)(1) of the Clean Air Act, which requires that the EPA “shall by regulation prescribe . . . standards applicable to the emission of any air pollutant from any class . . . of new motor vehicles . . . which in [the EPA Administrator’s] judgment cause[s], or contribute[s] to, air pollution . . . reasonably . . . anticipated to endanger public health or welfare,” 42 U. S. C. §7521(a)(1). The Act defines “air pollutant” to include “any air pollution agent . . . , including any physical, chemical . . . substance . . . emitted into . . . the ambient air.” §7602(g). EPA ultimately denied the petition, reasoning that (1) the Act does not authorize it to issue mandatory regulations to address global climate change, and (2) even if it had the authority to set greenhouse gas emission standards, it would have been unwise to do so at that time because a causal link between greenhouse gases and the increase in global surface air temperatures was not unequivocally established.
...
Massachusetts and other state and local governments, sought review in the D. C. Circuit [... which held...] that the EPA Administrator properly exercised his discretion in denying the rulemaking petition.
...
[Supreme Court Conclusion:] The judgment of the Court of Appeals is reversed, and the case is remanded for further proceedings consistent with this opinion.
(Global Warming Induced Climate Change Is A Matter of Law, quoting Massachusetts v. EPA, 549 U.S. 497, 127 S. Ct. 1438 (2007), emphasis added).  That case was decided by seven Republican-appointed justices, and two Democrat-appointed justices.

As with cases involving speeding laws, when we are stopped for exceeding the speed limit, it is of no moment to tell the police officer that we do not believe in speeding laws.

Fig. 3 Downtown Deniersville
Nevertheless, there are various underpinnings of just that within the ongoing political discourse coming out of the new York White House (Fig. 3) following the coup parade (A Tale of Coup Cities, 2, 3, 4, 5, 6, 7, 8, 9, 10, 11, 12, 13).

The Administrative Department has lost its way (You Are Here, "mad bull lost your way" - Rolling Stones @ Gimme Shelter), and in the tradition of the W Direction (The W Direction = The Perilous Path), now thinks it is the one with the say to make the laws rather than administer the laws.

They don't believe in any of that stinkin' clean air or stinkin' water jargon ("so what if I was exceeding the speed limit, I don't believe in speeding laws officer").

Not only that, they have even sent invaders into the realm of those who are required to enforce the law of the land.

Yes, and they are doing that nonsense even though the supreme law of the land (ruled as such by the Supreme Court) is contrary to their beliefs.

But, ignoring the legislative law of the congress, and the case law of the judicial branch of U.S. Government, they hazard this:
President-elect Donald Trump's Energy Department transition team sent the agency a memo this week asking for the names of people who have worked on climate change and the professional society memberships of lab workers, alarming employees and advisors.

The memo sent to the Energy Department on Tuesday and seen by Reuters on Friday, contains 74 questions including a request for a list of all department employees and contractors who attended the annual global climate talks hosted by the United Nations within the last five years.
(Trump Team Alarms Energy Department, emphasis added). They are alarmists of the authoritarian sort (The Authoritarianism of Climate Change). 

UPDATE: The McCarthyite request was rescinded after the DOI refused the request and congress members wrote them to say it was an abuse of authority (NewsMax).


To the contrary, I am an alarmist of the Paul Revere sort, holding two lanterns aloft while exclaiming "one if by land, two if by sea".

Anyway, it boils down to them wanting a list of the names of government employees who obey the law in "a government of laws, and not of men" so that those obedient government employees can be punished (The Queens of Stalingrad - 2).

Trust trumps paranoia.

The previous post in this series is here.

The Pillars of Knowledge: Faith and Trust?


Thursday, December 8, 2016

Is A New Age Of Pressure Upon Us? - 9

Fig. 1
I. Background

We get a lot of news about direct "feedbacks" from global warming.

This series is about indirect impacts that anthropogenic global warming has engendered (Global Warming & Volcanic Eruptions).

Seeking the full picture of indirect impacts, I have wondered for quite a while about how a graph would look if I used each and every PSMSL tide gauge station (all 1,465 of them) and did a mean average sea level change on the data (more on that later).

Global pressure on the crust of the Earth is one indirect impact of global warming, as rising tides and subsequent oscillating bottom pressures caused by melt water follow:
Fig. 2
"In this post we are not considering the pressures of 21st Century life, with its myriad social stresses and concerns.

A recent post at Ecocosmology Blog indicated that scientists have studied the varying effects and pressures of ocean levels on the crust of the Earth."
(Is A New Age Of Pressure Upon Us?, May 2010). So, in today's episode I will combine some of all of that into a hypothesis.

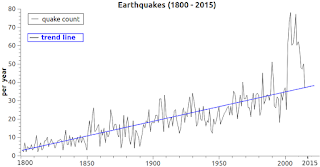
The hypothesis is that earthquakes have increased as ice sheet and glacial melt has led to the redistribution of cryosphere mass into the oceans.

That mass is relocated widely over the Earth's crust.

Thus, it could be related to the increase of earthquake events as explained in more detail below.

II. Telltale Graphs

Fig. 3 Same trend as sea level
Using the IPCC acceleration projection numbers of ~3 ft of sea level rise by 2100, I made the graphs at Fig. 1 and Fig. 2 using all PSMSL stations as I had wanted to for quite a while.

What makes the last ~85 years look steep in those two graphs is the fact that there was a lot of sea level fall during the first part of the PSMSL recorded time-frame (1807 - 1856).

Greenland was melting back then, releasing regular melt water as well as releasing the illusive ghost water too (Proof of Concept - 3, 5; The Ghost-Water Constant, 2, 3, 4, 5, 6, 7).

As a result, those northern hemisphere drops in sea level were predominant until other sources (Antarctica & land glaciers) began to contribute melt water too.

Fig. 4 [Zone, # of quakes]
Anyway, I created a new SQL database of earthquake events which contains (at this moment) almost 6,000 recorded earthquakes (~2000 BCE to 2016).

That earthquake data contained, among other things, the latitude and longitude of the epicenter of the quakes, so I was able to link the quakes to particular WOD Zones (e.g. Fig. 4).

The earthquake data in the graph at Fig. 3 indicates a constant increase trend in earthquake activity around the globe (see trend line @ Fig. 3).

Fig. 5 Same trend as earthquakes
The graph of the tide gauge station recorded sea level change activity in those WOD Zones, where the highest earthquake activity took place, is shown in Fig. 5.

It stands to reason that ongoing release of downward pressure on land mass as ice sheets melt, and the subsequent increase of downward pressure in other areas as the melt water and ghost-water are relocated to other ocean areas, changes the pressures placed on the Earth's crust.

Those increases and decreases in pressure can become triggers for earthquake activity in areas where just a little more or just a little less can break things loose (as in the case of fracking).

IMO, these observations that are being set forth in today's post give us sufficient accord so that we can put our lab coats on and proceed to the next task.

The next task is to falsify or verify the evolving hypothesis with more data, observations, and analysis.

III. Conclusion

If you are interested in this developing hypothesis, here is a list of the posts that have been previously published on this subject (Is A New Age Of Pressure Upon Us?, 2, 3, 4, 5, 6, 7, 8).

Fig. 6
If you care to have any contrary or supporting data considered, which relates to the falsifying or verifying of the hypothesis, you may provide it in the comment section (Dredd Blog comment philosophy explained here).

UPDATE: It dawned on me that Zones 7300, 1400, 1401, 1402, 1300, 1301, 1302, 1303 should be the first group for consideration (Fig. 6).

That means leaving out Zones 7109, 5107, 1304, 1305, 1307, 1313, and 1012 from (Fig. 5) because they are not in the same geographical area.

The reason is that the Zones being removed from consideration at this time, are not grouped properly geographically (they can be considered later).

 Thus, the focus is on the Mediterranean Sea area (Fig. 6).

We have some specific papers and news to work with for that area (Mediterranean Faults, cf.  Jerusalem Post).

The next post in this series is here, the previous post in this series is here.

Bill McGuire (University College London):


Monday, December 5, 2016

Invasion of The Port Snatchers

Fig. 1
"The immense cities lie basking on the beaches of the continent like whales that have taken to the land." - Arnold J. Toynbee

Fig. 2
Especially those cities that operate the largest seaports (The World's 10 Biggest Ports).

Seaports which face a foe (a foe called global warming induced climate change) that is geared up for the long haul, geared up to raise the sea level above normal operating levels, now, and for decades to come at those ports  (The Extinction of Robust Sea Ports, 2, 3, 4, 5, 6, 7, 8, 9).

Fig. 3

Fig. 4

The graphs at Fig. 1, Fig. 2, and Fig. 3 show sea level projections out to the year 2100, and include the sea level history at those ports.
Fig. 5

Fig. 6
Those three graphs are based on IPCC sea level projections, low and high.
Fig. 7

Fig. 8
Either way, low or high, the amount that the IPCC projects for those ports is problematic (Weekend Rebel Science Excursion - 44).

Fig. 9
Fig. 10
Graphs at Fig. 2 and Fig. 3 graph sea level at U.S. locations.

Fig. 11
Los Angeles and Long Beach (West Coast, Fig. 3) represent about the 18th and 21st largest sea ports (the pecking order on ports varies some from year to year).

Fig. 12
The U.S. East coast has several busy ports that are not in the top 20, but nevertheless, are quite important.

For example, the large naval base and port at Norfolk, VA, which already suffers some partial shutdowns due to sea level rise.

The WOD Zones (7412, 7312, and 7311) on the West Coast, along with the PSMSL tide gauge stations within those zones is as follows:

Zone [7412] had [32] stations:

Stn# 630, Stn# 1825, Stn# 193, Stn# 175, Stn# 1245, Stn# 1255, Stn# 1341, Stn# 688, Stn# 1152, Stn# 166, Stn# 921, Stn# 842, Stn# 1242, Stn# 527, Stn# 165, Stn# 385, Stn# 2298, Stn# 2127, Stn# 1633, Stn# 384, Stn# 1354, Stn# 127, Stn# 1325, Stn# 265, Stn# 1285, Stn# 1541, Stn# 1196, Stn# 2214, Stn# 1269, Stn# 1640, Stn# 378, Stn# 1639

Zone [7312] had [7] stations:

Stn# 2125, Stn# 1394, Stn# 10, Stn# 437, Stn# 1663, Stn# 1352, Stn# 508

Zone [7311] had [11] stations:

Stn# 795, Stn# 1457, Stn# 1013, Stn# 2126, Stn# 377, Stn# 245, Stn# 717, Stn# 766, Stn# 883, Stn# 256, Stn# 158

Total Stations: 50


Some fifty tide gauge station records spanning the years 1854 - 2015 were used to make the Fig. 2 graph from historical and projected future sea level rise.

The WOD Zones for the top ten seaports (1010, 1205, 1211, 1212, 1311, and 1312), which are not in the U.S., contain the following tide gauge stations within their boundaries:


Zone [1010] had [25] stations:

Stn# 1595, Stn# 1594, Stn# 1591, Stn# 1593, Stn# 1677, Stn# 248, Stn# 1702, Stn# 1678, Stn# 1589, Stn# 1592, Stn# 1703, Stn# 1183, Stn# 1746, Stn# 1534, Stn# 2032, Stn# 1351, Stn# 2068, Stn# 2033, Stn# 1248, Stn# 2034, Stn# 1275, Stn# 1894, Stn# 724, Stn# 1895, Stn# 1896

Zone [1205] had [4] stations:

Stn# 1494, Stn# 1887, Stn# 1716, Stn# 2185

Zone [1211] had [14] stations:

Stn# 933, Stn# 727, Stn# 1406, Stn# 1428, Stn# 1698, Stn# 987, Stn# 1674, Stn# 333, Stn# 1891, Stn# 1034, Stn# 1366, Stn# 1685, Stn# 1902, Stn# 269

Zone [1212] had [11] stations:

Stn# 934, Stn# 887, Stn# 1018, Stn# 1522, Stn# 1105, Stn# 1388, Stn# 1151, Stn# 1411, Stn# 1671, Stn# 545, Stn# 1356

Zone [1311] had [4] stations:

Stn# 1405, Stn# 1404, Stn# 1403, Stn# 614

Zone [1312] had [34] stations:

Stn# 979, Stn# 731, Stn# 723, Stn# 1513, Stn# 1100, Stn# 1101, Stn# 672, Stn# 1147, Stn# 1318, Stn# 661, Stn# 1586, Stn# 1007, Stn# 956, Stn# 1699, Stn# 1675, Stn# 959, Stn# 1527, Stn# 1628, Stn# 954, Stn# 1489, Stn# 1627, Stn# 1066, Stn# 1568, Stn# 1546, Stn# 1155, Stn# 1446, Stn# 1588, Stn# 970, Stn# 1445, Stn# 955, Stn# 997, Stn# 1324, Stn# 1108, Stn# 1365

Total Stations: 92


Wow, ninety two Tide Gauge Station locations with historical records going back to 1925 were used to make the graph at Fig. 1.

And finally, WOD Zones on the East Coast of the U.S. (7207, 7208, 7209, 7307, 7308, 7309, and 7407) have the following PSMSL tide gauge stations within them:


Zone [7207] had [7] stations:

Stn# 1646, Stn# 1928, Stn# 563, Stn# 2288, Stn# 2021, Stn# 2287, Stn# 1934

Zone [7208] had [27] stations:

Stn# 2286, Stn# 2289, Stn# 1297, Stn# 1909, Stn# 690, Stn# 526, Stn# 2296, Stn# 1193, Stn# 1714, Stn# 199, Stn# 428, Stn# 1638, Stn# 520, Stn# 1106, Stn# 1107, Stn# 188, Stn# 1701, Stn# 1187, Stn# 1424, Stn# 363, Stn# 1717, Stn# 1696, Stn# 1669, Stn# 270, Stn# 1182, Stn# 1858, Stn# 2123

Zone [7209] had [15] stations:

Stn# 918, Stn# 1020, Stn# 497, Stn# 1038, Stn# 919, Stn# 922, Stn# 538, Stn# 725, Stn# 828, Stn# 161, Stn# 920, Stn# 1835, Stn# 440, Stn# 2297, Stn# 1903

Zone [7307] had [35] stations:

Stn# 234, Stn# 1721, Stn# 1651, Stn# 1720, Stn# 1444, Stn# 862, Stn# 1431, Stn# 2294, Stn# 396, Stn# 2295, Stn# 719, Stn# 1636, Stn# 945, Stn# 399, Stn# 462, Stn# 1635, Stn# 299, Stn# 597, Stn# 1295, Stn# 481, Stn# 360, Stn# 971, Stn# 412, Stn# 1203, Stn# 311, Stn# 148, Stn# 1338, Stn# 636, Stn# 1337, Stn# 224, Stn# 2292, Stn# 135, Stn# 786, Stn# 1153, Stn# 180

Zone [7308] had [13] stations:

Stn# 1884, Stn# 1715, Stn# 1156, Stn# 2215, Stn# 246, Stn# 1641, Stn# 1136, Stn# 1670, Stn# 316, Stn# 716, Stn# 112, Stn# 395, Stn# 1537

Zone [7309] had [0] stations.

Zone [7407] had [35] stations:

Stn# 1223, Stn# 999, Stn# 173, Stn# 201, Stn# 137, Stn# 1798, Stn# 126, Stn# 1005, Stn# 144, Stn# 387, Stn# 951, Stn# 192, Stn# 1244, Stn# 1392, Stn# 1654, Stn# 366, Stn# 12, Stn# 1637, Stn# 519, Stn# 875, Stn# 848, Stn# 362, Stn# 856, Stn# 1068, Stn# 429, Stn# 430, Stn# 351, Stn# 776, Stn# 367, Stn# 1111, Stn# 775, Stn# 235, Stn# 288, Stn# 2291, Stn# 183

Total Stations: 132


Wooooo Hooooo, one hundred and thirty two tide gauge station historical records provide a good base, a good dataset, from which to project out to the year 2100.

That projection, low or high, signals deep trouble for national security:
The harms associated with climate change are serious and well recognized. The Government’s own objective assessment of the relevant science and a strong consensus among qualified experts indicate that global warming threatens, inter alia, a precipitate rise in sea levels, severe and irreversible changes to natural ecosystems, a significant reduction in winter snowpack with direct and important economic consequences, and increases in the spread of disease and the ferocity of weather events. [quoting U.S. Supreme Court]
...
"By volume, more than 95 percent of U.S. international trade moves through the nation's ports and harbors, with about 50 percent of these goods being hazardous materials." [quoting NOAA 'Ports']
(Will This Float Your Boat - 10). It is easy to see why the military, charged with national security, is troubled by the prospect of "more than 95%" of the nation's supply lines being cut (Will Elections Cure The Disease? - 2, 3).

After all, it was the military that just shut down a pipeline (Army Blocks Drilling of Dakota Access Oil Pipeline), because they have jurisdiction over "national security related supply lines" such as seaports in perilous times:
A soldier fighting in a war today has many of the same basic needs that a soldier had thousands of years ago. Meals, medicines, and munitions are just a few of the fundamental supplies that are needed to keep a military unit operating at full capacity. Soldiers require the same basic life necessities as civilians: nutrition, shelter, and medical supplies to maintain good health. But soldiers must also have weapons and the consumables that weapons need to function, such as ammunition, repair parts, and fuel. So, not surprisingly, great warriors throughout history have carefully planned their strategies around ["logistics" ... aka "warrior stuff"].
(Supply Line Warfare). A great warrior is coming to a seaport near you pilgrim.

Anyway, the other graphs (Fig. 4 through Fig. 12) show geographical and geophysical sources which are the origin of the sea level changes, including some satellite measurements intermingled with PSMSL measurements (Fig. 4, Fig. 5, and Fig. 6).