Pages

Saturday, November 24, 2018

In Search Of Ocean Heat

Fig. 1 WOD layers
In recent posts I have been discussing a paper produced by researchers who felt that calculation of heat content in the ocean was substantially inadequate.

Their solution was to use in situ measurements of the atmosphere in order to estimate ocean heat content (Beware of Double Downers, On Resplandy Et Alia (2018), 2).

According to their thinking, our in situ measurements of ocean conditions (e.g. temperature & salinity) were defective, too few, or otherwise not the best way to detect ocean heat content.

Other competent researchers have indicated that there is work to be done in that area of oceanography.

The criticism of both teams was in terms of ocean heat content:
"The quest in this work is to derive a variable that is conservative, independent of adiabatic changes in pressure, and whose conservation equation is the oceanic version of the first law of thermodynamics. That is, we seek a variable whose advection and diffusion can be interpreted as the advection and diffusion of ‘heat.’ In other words, we seek to answer the question, ‘what is heat’ in the ocean?
...
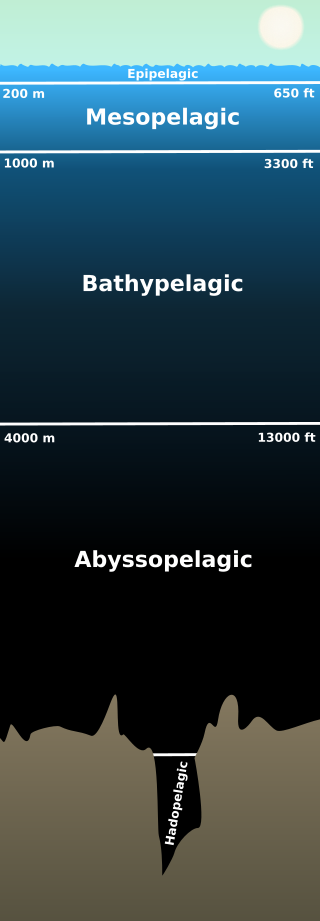
Fig. 2 Pelagic depths
The variable that is currently used for this purpose in ocean models is potential temperature referenced to the sea surface, θ, but it does not accurately represent the conservation of heat because of (i) the variation of specific heat with salinity and (ii) the dependence of the total differential of enthalpy on variations of salinity.
...
For example, an increase in pressure of 107 Pa (1000 dbar), without exchange of heat or salt, causes a change in enthalpy that is equivalent to about 2.5ЊC. We show in this paper that in contrast to enthalpy, potential enthalpy does have the desired properties to embody the meaning of the first law.
...
Present treatment of oceanic heat fluxes is clearly inconsistent. Ocean models treat potential temperature as a conservative variable and calculate the heat flux across oceanic sections using a constant value of heat capacity. By contrast, heat flux through sections of observed data is often calculated using a variable specific heat multiplying the flux of potential temperature per unit area (Bryan 1962; Macdonald et al. 1994; Saunders 1995; Bacon and Fofonoff 1996). Here it is shown that the theoretical justification of this second approach is flawed on three counts. While the errors involved are small, it is clearly less than satisfactory to have conflicting practices in the observational and modeling parts of physical oceanography, particularly as an accurate and convenient solution can be found.
...
it is perfectly valid to talk of potential enthalpy, h0, as the 'heat content' ...”
(Potential Enthalpy: A Conservative Oceanic Variable for Evaluating Heat Content and Heat Fluxes, McDougall 2003, pp. 945-46, emphasis added; cf. TEOS-10 gsw_CT_from_pt). So, in this post and in its graphs (Fig. 3a - Fig. 3e) potential enthalpy is presented as a valid calculation of the 'heat content' in the ocean.

Fig. 3a
Fig. 3b
Fig. 3c
Fig. 3d
Fig. 3e
The WOD layers where the in situ measurements were taken are shown by small blue squares at layers 0, 4, 8, 12, and 16 (Fig. 1).

A WOD layer is simply a list of WOD Zones (36 zones per layer) at 10 degree high latitude bands across the globe.

The distribution shown gives a polar, equatorial, and in-between look at heat content in both hemispheres.

The potential enthalpy (h0) is calculated as specific enthalpy (h) minus dynamic enthalpy (h) using two TEOS-10 functions:

h0 = h - h

The values are divided by 1000  to make the left-side numbers on the graph smaller so they take up less space on the graphs, (hence the x 103 notation).

Notice that the 'heat content' is not uniform at equal depths in all locations.

Polar shallows (epipelagic) have less heat content (J / kg) than deeper depths (bathypelagic & abyssopelagic), but non-polar layers tend to have less heat content as the depths increase.

The bottom line is that there is enough  data with which to use TEOS-10 functions to calculate the heat dynamics in the oceans.

By that I mean the heat content in terms of Joules per kilogram (J / kg) over spans of many years.

No matter how we look at it, we find that the poles have less "heat" on the surface, but have more "heat" (a.k.a. "less cold") impacted water at the deeper depths.

This is the result of the significant ocean currents circling Greenland & Antarctica preparing to disintegrate or melt the many tidewater glaciers there (Antarctica 2.0, 2, 3, 4, 5, 6 [& supplements A, B, C, D, E, F]; Mysterious Zones of Antarctica - 3; Mysterious Zones of The Arctic - 3).
Fig. 4 Mean Average All Zones

The graph at Fig. 4 shows the mean average of all WOD Zones in all layers (0-16) ... 17 has no data.

We don't have to look for less cold water to melt the great ice sheets that jut into the Antarctic waters.

There is already plenty of "heat" to do the job (Government Climate Change Report, 2, 3, 4, 5, 6, 7, 8, 9, 10, 11).

The latest Government Climate change report released Friday (in order to try to hide it?), has the characteristic of getting very serious (A Grave Climate Warning, Buried on Black Friday).

Officialdom can't say it was not warned, but it can say it did not heed the warnings.

The next post in this series is here.


Friday, November 23, 2018

On Resplandy Et Alia (2018) - 2

Fig. 1 WOD layers
In the first post of this series I mentioned the intellectual honesty of the team of researchers who made an unorthodox effort.

There is nothing ipso facto wrong with an unorthodox effort to estimate the quantity of heat or heat uptake in the oceans or to criticize traditional ways of doing it (On Resplandy Et Alia (2018)).

I was impressed with their admission to a serious mistake in their paper that was discovered by another researcher who was not involved in their research (Beware of Double Downers).
Fig. 2 Pelagic depths

At the same time I criticized their characterization of the current sources, and/or the lack thereof, for in situ ocean measurements (ibid).

To support my criticism I listed what publishers of journals tend to consider official sources for that very information, and more (id.).

To cement the criticism, I pointed out that scientific journals are beginning to require that those who submit papers to them must indicate the specific sources where they acquired the datasets used in submitted papers (id.).

Such requirements facilitate one of the more important elements of the dynamics of scientific papers, which is the ability to verify or falsify the essential elements of hypotheses set forth in scientific papers.

Only valid papers are composed of one or more hypotheses that can be falsified or verified.

The Resplandy et al. (2018) paper criticized ARGO float data using generalities without adequate specifics, and it failed to list any bona fide alternate sources of datasets.

In effect they rejected the plethora of worthy sources for in situ data going back hundreds of years.
Fig. 3a Layer 0
Fig. 3b Layer 4
Fig. 3c Layer 8
Fig. 3d Layer 12
Fig. 3e Layer 16
In addition to that, part of their main hypothesis, "we can't trust ocean measurements", was based on measurements of elements such as O2 and CO2 in the atmosphere.

Our science, economics, engineering, and our "world", are based on measurements, so they ideologically avoided a lot of measurements (The World According To Measurements, 2, 3, 4, 5, 6, 7, 8, 9, 10, 11, 12, 13, 14, 15, 16, 17, 18, 19, 20, 21).

But alas they favored a plethora of other measurements without explaining sufficiently, IMO, why measurement set "X" is better than measurement set "Y."

Their extrapolation was based on random sources of atmospheric measurements, evidently under the assumption that atmospheric measurements are a better indication of how much heat is in the ocean than actual measurements of the heat in the ocean are.

The heat in the ocean is always trying to hide it would seem ("its here, its there, its everywhere").

Which brings up, among other things, "heat."

I have recently written about "enthalpy," which, in the context of TEOS-10 is heat related (On Thermal Expansion & Thermal Contraction - 39, Hot, Warm, & Cold Thermal Facts: Tidewater-Glaciers - 7, In Pursuit of Plume Theory).

The TEOS-10 documentation indicates that enthalpy is important in terms of ocean heat content (cf. Potential Enthalpy: A Conservative Oceanic Variable for Evaluating Heat Content and Heat Fluxes, McDougal 2003; and TEOS-10 gsw_CT_from_pt).

So, today's graphs (Fig. 3a - Fig. 3e) show the results of the TEOS-10 function gsw_enthalpy_t_exact at locations marked on Fig. 1 (blue squares), and depths shown on Fig. 2.

The point of the graphs and this post is that the heat distribution in the ocean is anything but uniform.

In that regard (non-uniformity), it is like sea level change (The Gravity of Sea Level Change, 2, 3, 4; NASA Busts The Ghost; The Ghost-Water Constant, 2, 3, 4, 5, 6, 7, 8, 9).

The enthalpy in one "place" can be very different than enthalpy at another "place" (both "places" being seawater at equal depths but at a different latitude and longitude).

In a subsequent post I will focus on "potential enthalpy" to enhance this series.

The previous post in this series is here.

"He say one and one and one is three ..."


Wednesday, November 21, 2018

Happy Thanksgiving !


... and Season's Greetings.


How To Identify The Despotic Minority - 6

Rudy Poot
The "W" had this Pootie Poot and now The Don has his Rudy Poot (see photo).

The Despotic Minority is plodding along (How To Identify The Despotic Minority, 2, 3, 4, 5) unabashed by the election results (In The Wave Strike - 2).

So, I thought I would share another writer's take on the issue, written several years before my writing on the issue of The Despotic Minority.

That writer pointed out one potential embryonic beginning of that minority:
"... with the advent of the Tea Party, the United States is experiencing the ... tyranny ... of the minority."
(The Tea Party’s Dangerous Tyranny of the Minority). That article presents an apt description of a source of despotic ideology.

Remember that Toynbee pointed out the seriousness of a despotic minority:
"In the Study Toynbee examined the rise and fall of 26 civilizations in the course of human history, and he concluded that they rose by responding successfully to challenges under the leadership of creative minorities composed of elite leaders. Civilizations declined when their leaders stopped responding creatively, and the civilizations then sank owing to the sins of nationalism, militarism, and the tyranny of a despotic minority. Unlike Spengler in his The Decline of the West, Toynbee did not regard the death of a civilization as inevitable, for it may or may not continue to respond to successive challenges. Unlike Karl Marx, he saw history as shaped by spiritual, not economic forces" ...
(How To Identify The Despotic Minority - 4, quoting Encyclopedia). A despotic minority and its tyranny is openly being written about in many places, which now includes the Supreme Court (Challenge to Trump's Whitaker).

Obstruction of justice is child's play to the despotic minority's Authoritarian Leader, who has bragged that they would even stick with him if he shot someone on Fifth Avenue.

He is headed there, because according to another writer, he is an accessory to murder (Donald Trump Is An Accessory To Jamal Khashoggi’s Murder, by Richard North Patterson).

One thing remaining to wonder about is whether or not the justice system is also an accessory because the DOJ refuses to indict a sitting president under any circumstances (What Does The Word "Whoever" Mean?).

The next post in this series is here, the previous post in this series is here.


Tuesday, November 20, 2018

On Resplandy Et Alia (2018)

Fig. 1 WOD Layers
I. Background

Today's post is about the research paper that recently made headlines all over the place (Beware of Double Downers).

Fig. 2
Fig. 3
Fig. 4
This post speculates as to why the error was made and is akin to the long lasting "ghost water" phenomenon of a year or so back (NASA Busts The Ghost).

In other words, this post is not a criticism of the authors of the paper, it is a reflection on how any and all researchers can be misled.

II. One Problem

One problem that leads us astray when we are researching is not having a grasp of where to find and use data.

That paper focused on ARGO data and criticized all in situ measurements because ARGO data was said to be defective to the point of requiring a new way to find out about the ocean without using measurements of the ocean:
"The ocean is the main source of thermal inertia in the climate system1. During recent decades, ocean heat uptake has been quantified by using hydrographic temperature measurements and data from the Argo float program, which expanded its coverage after 20072,3. However, these estimates all use the same imperfect ocean dataset and share additional uncertainties resulting from sparse coverage, especially before 20074,5. Here we provide an independent estimate by using measurements of atmospheric oxygen (O2) and carbon dioxide (CO2)—levels of which increase as the ocean warms and releases gases—as a whole-ocean thermometer."
(ibid, Resplandy et al. 2018). It seems as if the authors were saying that there are not a sufficient number of viable sources for in situ ocean measurements.

That is why I suggest using the very best sources, then being careful to point out areas of concern (Build Your Own Thermosteric Computational System, 2; Build Your Own Sea Level Change Fingerprinting System).

The sources we have are adequate for fully exposing the obvious catastrophe facing current civilization (Civilization Is Now On Suicide Watch, 2, 3, 4, 5, 6, 7, 8).

But, far too many researchers have been muzzled into the trance of denial about such matters:
One scientist who was recently arrested at the White House, and who had to retire from NASA, put some scientific observations to work on this scientific reality:
"I suspect the existence of what I call the `John Mercer effect'. Mercer (1978) suggested that global warming from burning of fossil fuels could lead to disastrous disintegration of the West Antarctic ice sheet, with a sea level rise of several meters worldwide. This was during the era when global warming was beginning to get attention from the United States Department of Energy and other science agencies. I noticed that scientists who disputed Mercer, suggesting that his paper was alarmist, were treated as being more authoritative.

It was not obvious who was right on the science, but it seemed to me, and I believe to most scientists, that the scientists preaching caution and downplaying the dangers of climate change fared better in receipt of research funding. Drawing attention to the dangers of global warming may or may not have helped increase funding for relevant scientific areas, but it surely did not help individuals like Mercer who stuck their heads out. I could vouch for that from my own experience. After I published a paper (Hansen et al 1981) that described likely climate effects of fossil fuel use, the Department of Energy reversed a decision to fund our research, specifically highlighting and criticizing aspects of that paper at a workshop in Coolfont, West Virginia and in publication (MacCracken 1983).

I believe there is a pressure on scientists to be conservative. Papers are accepted for publication more readily if they do not push too far and are larded with caveats. Caveats are essential to science, being born in skepticism, which is essential to the process of investigation and verification. But there is a question of degree. A tendency for `gradualism' as new evidence comes to light may be ill-suited for communication, when an issue with a short time fuse is concerned."
(Scientific Reticence and Sea Level Rise, James Hansen)
(On Thermal Expansion & Thermal Contraction - 8). When it is time to sound the alarm, sound it long and loud.

III. My Take On The Issue

I think that the real problem is one caused by the misapplication of the current loud and clear data we have.

It is said and written over and over that the global oceans together absorb over 90 percent of the excess heat in the climate system, but more important than that, is where that heat is headed:
"The vast Southern Ocean, which surrounds Antarctica, plays a starring role in the future of climate change. The global oceans together absorb over 90 percent of the excess heat in the climate system and roughly three-quarters of that heat uptake occurs in the Southern Ocean. In addition, the global oceans absorb around 25 percent of anthropogenic carbon dioxide emissions and the Southern Ocean alone accounts for about half of the uptake of CO2.

Despite its critical role in our climate system, the Southern Ocean has gone almost completely unobserved. Scientists have struggled to gather precise measurements because of the harsh environment and extreme remoteness. The changing dynamics of the Southern Ocean will in turn drive key aspects of our future climate, including how sensitive the Earth will be to further warming and increases in carbon dioxide emissions. As a result, improved observations are crucial to helping scientists understand and predict how our climate will change."
(Hot, Warm, & Cold Thermal Facts: Tidewater-Glaciers - 6). That post was written while Resplandy et al. (2018) were putting the finishing touches on their paper.

Researchers are not, due to the Mercer effect,  paying sufficient attention to where the heat that is absorbed is headed ("The global oceans together absorb over 90 percent of the excess heat in the climate system and roughly three-quarters of that heat uptake occurs in the Southern Ocean", ibid).

IV. Oh Yeah, The Graphs

The graphic at Fig. 1 is the oft posted WOD map of zones of in situ measurements (it covers the globe).

I used that data (including SOCCOM & GISTEMP) to produce the graphs at Fig. 2 - Fig. 4.

The theme of these graphs is that one can detect the movement of the warmth from the surface of the ocean down into deeper depths where currents carry that warmth to the Southern Ocean (Antarctica).

That freeway down to and around Antarctica is not too shabby:
"The Antarctic Circumpolar Current moves 140 million cubic meters (4.9 billion cubic feet) of water per second around Antarctica. That single current moves more water than all the rivers on the planet combined. The world's rivers move 1.3 million cubic meters (46 million cubic feet) of water per second."
(Mysterious Zones of Antarctica - 2). If one wants to watch the area where "the doomsday glacier" keeps on calving, then they should stay away from research about the Baltic Sea.

Anyway, the graph at Fig. 2 shows: 1) the GISTEMP temperature anomalies, 2) the seven percent staying in the atmosphere, and 3) the ninety some odd percent going into the oceans.

Additionally it shows the Resplandy et al. (2018) paper's estimation of heat energy custom retro graphed back to 1880 (informed by GISTEMP data).

The graph at Fig. 3, bottom pane, shows the result of graphing every in situ ocean temperature measurement in the WOD, SOCCOM, OMG, WHI, etc. datasets (billions of measurements).

Along with the graph at Fig. 4, which shows that the Southern Ocean temperatures (around the largest ice sheet location and the coldest air) are warming more than the other oceans are.

That dove-tails with the statements I quoted above ("The global oceans together absorb over 90 percent of the excess heat in the climate system and roughly three-quarters of that heat uptake occurs in the Southern Ocean.").

V. Go Where The Money Is

I have written more than once about the detective who asked the suspect "Why do you rob banks?" and then received the answer "Because that is where the money is."

Researchers will do well ("go where the money is") to use the official datasets which have ample data with which to avoid bad results (The Warming Science Commentariat - 11).

VI. Conclusion

I hope that all the authors of the paper do not give up on their quest for alternative means and methods of discovery.

That angle is apt to lead to good things.

But, at the same time I hope that they stop trashing what we have now, and what we can find out about playing in the majors without playing with the minors.

"Outside in the cold distance, a wild cat did growl, two riders were approaching, and the wind began to howl." (All Along The Watchtower" - Dylan).

The next post in this series is here.

All along the research watchtowers ...


Sunday, November 18, 2018

Beware of Double Downers

Make Sure
I. Aware vs Beware

The airwaves are full of those who make patently false statements about most anything, then when called out on it they "double down."

And that degenerate practice of "doubling down" makes it seem like intellectual honesty is a relic of the past.

The "doubling down" I am talking about is:
"The term is increasingly used as a media euphemism when political figures tell bald-faced lies and when confronted with contradictory statements, the politician not only fails to retract their claims but instead expresses an increased certainty in their truth."
(Urban Dictionary). The ConWay and The Don are currently very usable sources for observing episodes of the misadventure of doubling down.

They are constantly using "alt-facts" and truthiness for deluding themselves and others.

Especially when it comes to global warming induced climate change, they are aficionados of doubts and lies on steroids.

II. A Recent Episode of Aware vs. Beware

A recent scientific paper hypothesized that scientists had missed the mark when it came to estimating the quantity of heat-content increase in the world oceans.

According to one person who read their paper, they had miscalculated some critical factors involved in the issues they had analyzed.

That is not a biggie in and of itself, because it is a good thing when other scientists, who were not involved in the relevant research, analyze a hypothesis.

The catch on this one paper is that the criticism that those scientists had issued in the paper was where there was a large error.

Their paper estimated that world scientists had missed the actual amount of ocean heat intake by about sixty percent (60%).

An observant and aware scientist or observer found a considerable error in the research team's math and its application.

Did the research team double down?

No.

Being intellectually honest professionals they acknowledged their error and thanked the scientist or observer who had caught their mistake and who had contacted them about it:
"I, with the other co-authors of Resplandy et al (2018), want to address two problems that came to our attention since publication of our paper in Nature last week. These problems do not invalidate the methodology or the new insights into ocean biogeochemistry on which it is based, but they do influence the mean rate of warming we infer, and more importantly, the uncertainties of that calculation.

We would like to thank Nicholas Lewis for first bringing an apparent anomaly in the trend calculation to our attention. We quickly realized that our calculations incorrectly treated systematic errors in the O2 measurements as if they were random errors in the error propagation."
(RealClimate, Resplandy et al. correction and response). Since scientific research reporting is not so anal retentive that it does not allow any mistakes, this behavior by Resplandy et al. via Ralph Keeling is a useful example for all of us to follow.

III. Another Episode

Another practice for journals and other scientific literature outlets to emulate is source-data transparency:
"Data underpinning any research finding should be findable, accessible, interoperable, and reusable (FAIR) – not only for humans, but also for machines. Therefore, Copernicus Publications requests that such data are available upon publication of an article, with only a few standard and widely adopted exceptions, such as those concerning the privacy of human subjects or data that may place vulnerable species or sites at risk.

Research data should, to the greatest extent possible, be shared: at the very least, data should have unique and persistent identifiers and appropriate metadata to assist discovery and be cited in a form equivalent to other scholarly outputs. These data should be openly accessible and stored in community-approved FAIR-aligned repositories. Leading repositories provide additional quality checks regarding domain data and data services, and they facilitate discovery and reuse of data and other research outputs. Suitable data repositories can be found in the Registry of Research Data Repositories. In order to elaborate on our commitment, we have updated our data policy and author guidelines."
(Copernicus Org, emphasis added). Of course, other journal publishers hold to that same standard, which is quite reasonable.

Their mention of  "the Registry of Research Data Repositories" caught my eye, so I checked it out.

Some of the main sources of oceanographic data Dredd Blog uses are listed in that repository:
World Ocean Database (WOD)
Permanent Service For Mean Sea Level (PSMSL)
GISTEMP
NSIDC
(Registry of Research Data Repositories).  The official software for ocean thermodynamic computations that Dredd Blog uses (TEOS-10) is also of good repute:
"Having considered the presentation of the Chairperson of the SCOR/IAPSO WG-127 to the 25 th Session of the Assembly,

Decides to adopt the International Thermodynamic Equation of Seawater (TEOS-10) formulation that has been developed and recommended by the SCOR/IAPSO WG-127 to replace the existing EOS-80, as presented in the TEOS-10 Manual (IOC/INF- tbd );

Requests the IOC Executive Secretary to:

(i)     publish a suitably shortened and simplified version of the TEOS-10 manual in the IOC Manuals and Guides series

(ii)     continue to work closely with the SCOR/IAPSO WG-127 to ensure wide dissemination of TEOS-10 to government agencies, the scientific community, and industry

(iii)     ensure that the shortened and simplified manual contains a detailed, scheduled implementation plan allowing a traceable, stepwise implementation of the new standard;

Urges Member States to use and disseminate TEOS-10."
(Intergovernmental Oceanographic Commission, Twenty-fifth Session of the Assembly, p. 99 PDF); cf. Ocean Best Practices TEOS-10, UNESCO TEOS-10).

IV. Your Part

Like Nicholas Lewis, who brought the mistake of Resplandy et al. (2018) into focus, when any regular readers or irregular readers see a mistake in Dredd Blog posts, it will be appreciated if you share your observations (in comments or emails).

I take on some very big issues (e.g On Thermal Expansion & Thermal Contraction, 2, 3, 4, 5, 6, 7, 8, 9, 10, 11, 12, 13, 14, 15, 16, 17, 18, 19, 20, 21, 22, 23, 24, 25, 26, 27, 28, 29, 30, 31, 32, 33, 34, 35, 36, 37, 38) and there are bound to be some mistakes in my work.

If we become scientific sycophants we are not using intellectual honesty.

Instead, we are making a false religion or false philosophy out of our efforts.

We would also be deluding ourselves by thinking that we can use doubling down and other alt-truthiness behaviors to produce "knowledge" (The Pillars of Knowledge: Faith and Trust?).

V. Conclusion

This will help all of us become more knowledgeable:
"Research data are valuable and ubiquitous. The permanent access to research data is a challenge for all stakeholders in the scientific community. The long-term preservation and the principle of open access to research data offer broad opportunities for the scientific community. More and more universities and research centres are starting to build research data repositories allowing permanent access to data sets in a trustworthy environment. Due to disciplinary requirements, the landscape of data repositories is very heterogeneous. Thus it is difficult for researchers, funding bodies, publishers and scholarly institutions to select appropriate repositories for storage and search of research data.

re3data.org is a global registry of research data repositories that covers research data repositories from different academic disciplines. It presents repositories for the permanent storage and access of data sets to researchers, funding bodies, publishers and scholarly institutions. re3data.org promotes a culture of sharing, increased access and better visibility of research data. The registry went live in autumn 2012 and is funded by the German Research Foundation (DFG)."
(Re3data Org).

It is difficult enough to practice the science of knowledge production while being intellectually honest.

The use of doubling down and other degenerate practices in a vacuum of dishonor is to be avoided, because it makes the research efforts orders of magnitude more difficult.