 |
| Fig. 1 World Ocean Database Layers 6-11 (Blue Rectangle) |
I. Ocean Heat Is Where?
In today's post we will, once again, take a look at the part which measurements and photons play in Oceanography.
More specifically, we will take a look at the part that quantity of measurements plays, and the part that historical measurements can play.
The gist of it is that I am contrasting two approaches to measurements: the abundant use of historical quantities compared to the use of only recent quantities for constructing conclusions (For example, Fig. 1 shows two areas of research, one being the area in the blue rectangle, the other being the area in the red rectangle).
The researchers who published the following paper did their research in the red rectangle area, and wrote this about their research:
Fig. 2 Deepest Pelagic Depths "Abstract Consecutive multiyear records of hourly ocean bottom temperature measurements are merged to produce new decade‐long time series at four depths ranging from 1,360 to 4,757 m within the northwest Argentine Basin at 34.5°S. Energetic temperature variations are found at a wide range of time scales. All sites exhibit fairly linear warming trends of approximately 0.02–0.04°C per decade over the period 2009–2019, although the trends are only statistically different from zero at the two deepest sites at depths of ~4,500–4,800 m. Near‐bottom temperatures from independent conductivity‐temperature‐depth profiles collected at these same locations every 6–24 months over the same decade show roughly consistent trends. Based on the distribution of spectral energies at the deepest sites and a Monte Carlo‐style analysis, sampling at least once per year is necessary to capture the significant warming trends over this decade to within 50% error bars at a 95% confidence limit ...
Fig. 3 Deepest Pelagic Depths Plain Language Summary Quantifying global temperature changes requires observations of the full atmosphere‐ocean system; however, long‐term, continuous observations of temperature deep within the ocean are exceedingly rare. This study presents several decade‐long records of hourly temperature measurements from moored sensors 1 m above the seafloor in the northwestern Argentine Basin within the western South Atlantic Ocean. These sites, which range in depth from 1,360 to 4,757 m, show energetic temperature variations on daily to interannual time scales. The intensity of these variations is higher at the two shallower sites than is observed at the two deeper sites. In addition to the daily to interannual variations, long‐term warming trends are also detected over the period 2009–2019 at all four sites. The study also uses the hourly records at the two deeper sites to estimate how frequently the temperature at these locations must be observed in order to estimate the long‐term trends accurately."
II. Ocean Heat Is Where You Find It
In contrast to the red-rectangle area used for their research, I used World Ocean Database (WOD) records of in situ measurements taken in the blue rectangle area.
 |
| Fig. 4 Deepest Pelagic Depths |
There were sufficient historical records, at deeper depths than they measured, to construct the graphs shown at Fig. 2, Fig. 3, and Fig. 4, so I am skeptical of their statement that "continuous observations of temperature deep within the ocean are exceedingly rare" (Especially since the span of time I covered is twice what they covered).
To be clear, I am not skeptical of their general conclusion, which is that the ocean is warming, but I would add that the shallow areas at the poles are not warming because as the ice melts it cools the upper depths there.
It is the deeper waters that are warmer in polar regions, which is why the tidewater glaciers are melting at an accelerating rate (Antarctica 2.0, 2, 3, 4, 5, 6 [& supplements A, B, C, D, E, F], 7).
I am also presenting graphs in the three appendices which show that there are abundant measurements in the WOD database for shallower depths than Fig. 2 - Fig. 4 depict.
Those graphs in those appendices are made using WOD Layers 1-15, which covers the entirety of the world oceans, except for the polar regions (Layers 0, 16-17).
In previous posts I have explained the vastness of the WOD:
"To the contrary, when we run 5.5 billion or so in situ measurements through the TEOS-10 toolkit [C++ version], which is based on the thermodynamics of oceanography advanced by Josiah Gibbs, we come up with a different perspective, which we call reality (The World According To Measurements - 12)."
(On Thermal Expansion & Thermal Contraction - 42). It is clear that there is more evidence available than many researchers care to handle (In Search Of Ocean Heat, 2, 3, 4, 5, 6, 7, 8).
III. Closing Comments
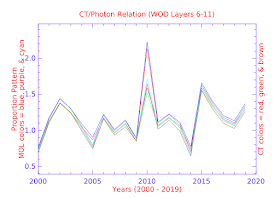
Today's three appendices are linked to in the following menu:
| Appendix Subject | Link |
| Photon Count (mol/kg) | Graph Page One |
| CT / Photon Relation | Graph Page Two |
| Conservative Temperature | Graph Page Three |
The reality is that ocean heat is "potential enthalpy" (Potential Enthalpy: A Conservative Oceanic Variable for Evaluating Heat Content and Heat Fluxes, McDougall 2003, pp. 945-46).
Potential Enthalpy (hO) in turn is photon energy, in terms of the spread of heat throughout the ocean depths.
Which is why I like to call it Quantum Oceanography from time to time (Quantum Oceanography, 2, 3).
The next post in this series is here, the previous post in this series is here.
Ode to the despotic minority ...


No comments:
Post a Comment