Pages

Friday, May 20, 2016

The Extinction of Robust Sea Ports - 6

Troubles Rising
I. Overall Issues

Human civilization in general rejected renewable energy long ago, when it was utterly abundant, universal, and so cheap it was almost free.

The context now is: a global danger.

The question, then, is "what can culture / civilization (not individuals) do about that?" since culture / civilization rejected natural, renewable energy long ago --without our collective and our individual input.

Was anyone reading this post asked about it back in 1750 when the Industrial Revolution Rejection began to take place?

No.

The reactionary question now should be: "can this current civilization, this culture, go back to the natural renewable energy of the natural Earth ecosystem that existed back then?"

That natural, renewable energy system existed for eons, for use by pre-human species, and for use by humans once they came along.

So, those who use what is now toxic-technology to make "something new," to replace something that has existed abundantly since before any civilization had evolved, are missing something (BTW that "something" isn't imagination).

But let's get real by noticing that the at-one-time most-quoted-historian was neither optimistic nor pessimistic when he wrote:
"In other words, a society does not ever die 'from natural causes', but always dies from suicide or murder --- and nearly always from the former, as this chapter has shown."
(The Authoritarianism of Climate Change, quoting "A Study of History", by Arnold J.Toynbee). Again, he was neither optimistic nor pessimistic, he was simply being historical.

Further, the central question becomes "can this current civilization go back to natural renewable energy" rather than the central question being "is it possible in the abstract?" (remember "anything is possible" in the abstract, so that is a meaningless question).

Why is this civilization (the Anthropocine, the purveyors of the ongoing Sixth Mass Extinction) more able than the others before it? (boundless imaginary hope?)

How is our civilization more ecologically adept than those which historian Toynbee studied, then wrote about? (see quote above)

Those civilizations that committed suicide, or were murdered?

Since we all tend to think that "anything is possible" in the abstract, we should start to remember that we are not in "the abstract" (here in reality, many things are simply not possible).

Civilization  has never been in the abstract (Civilization Is Now On Suicide Watch, 2, 3, 4, 5, 6, 7, 8).

II. Seaport Civilization Faces Itself

I have wondered a time or two if we should first go back to "a renewable ocean" (Why Sea Level Rise May Be The Greatest Threat To Civilization, 2, 3, 4, 5).

How is that going to work for us, assuming civilization is preparing for that future:
The majority of seaports around the world are unprepared for the potentially damaging impacts of climate change in the coming century, according to a new Stanford University study.
(Stanford News). So, why is that relevant?

For one thing, we are like the long gone Phoenician civilization (The Extinction of Robust Sea Ports - 3).

Since most of our seaports are unprepared, then our civilization is likewise mostly unprepared:
Container-laden ships traverse countless supply chains from continent to continent, a method of transportation that accounts for more than 90 percent of the world trade by volume.
(Smithsonian). Do you or I, as individuals, feel ok when we are "mostly unprepared" for something?

Regardless, since civilization is a group (not individuals) civilization must be prepared if it is to honestly feel comfortable (“Insanity in individuals is something rare – but in groups, parties, nations and epochs, it is the rule.” – Friedrich Nietzsche).

III. Some Sea Level Rise Graphs of Some Unprepared Seaports

I will list a few Dredd Blog Zones (see Zone In On Sea Level Change for a description of zones).

Graphs of sea level change in that zone will also be listed.

The following zones have various numbers of seaports within the zone boundaries.

Each seaport has a world ranking, in terms of volume of container trade.

These all have PSMSL tide gauge stations which began keeping sea level records in the 1800s within the zone boundary:

Shanghai, China: rank=1
Busan, S. Korea, rank=5
Qingdao Gang, China, rank=7
Taicang, China, rank=42
Gwangyang Hang, S. Korea, rank=63
Incheon, S. Korea, rank=65

Rotterdam, Netherlands: rank=11
Antwerp, Belguim, rank=16
Felixstowe, U.K., rank=37
Port of Le Havre, FR, rank=59
Bruges, Belguim, rank=70

Hamburg, Germany: rank=15
Bremen, Germany, rank=23

New York City, U.S.A.: rank=26

IV. Conclusion

As you can see, each zone tends to have its own degree of sea level change, which impacts upon different seaports in different ways.

Thus, each one has to be analyzed, repaired, moved, modified, or abandoned based on conditions in that zone.

Some nations are already suffering as a result of giving up national strengths to then have to rely on international seaport trade (Behind the Food Lines in Venezuela).

Videos below show the rather intensive construction and modification problems facing each different area.


"Stunning Singapore"
(Something Stunning Is Taking Place Off The Coast Of Singapore)


The next post in this series is here, the previous post in this series is here.

Thursday, May 19, 2016

The Fleets & Terrorism Follow The Oil - 6

Darth Invader of Oil-Qaeda Wants More Oil
This series began in 2009.

There was a very interesting post @ Seemorerocks Blog (‘Made in USA’: 3 key signs that point to Washington’s hand in Brazil’s ‘coup’).

I liked it a lot, so I made this comment on that New Zealand blog:
Yes, Brazil is another nation that has been overthrown by and for Oil-Qaeda.

I saw it coming and wrote about it half a decade ago (The Fleets & Terrorism Follow The Oil - 2).

No biggie, the same imperial habit was written about in 1944:

"The enemy aggressor is always pursuing a course of larceny, murder, rapine and barbarism. We are always moving forward with high mission, a destiny imposed by the Deity to regenerate our victims, while incidentally capturing their markets; to civilise savage and senile and paranoid peoples, while blundering accidentally into their oil wells or metal mines."

(The Authoritarianism of Climate Change, quoting "As We Go Marching").
If you haven't already, go read the Seemorerocks story (link in 1st sentence of this post).

It shows that Obama is a phony climate change politician who chases the oil that is destroying civilization as he talks out of the other side of his mouth while practising rank imperialism as just another vassal (American Feudalism, 2, 3, 4, 5, 6, 7, 8, 9, 10, 11).

Get used to it, because our government is psychotic and therefore cannot change (When You Are Governed By Psychopaths - 2).

The previous post in this series is here.


Tuesday, May 17, 2016

The Bathtub Model Doesn't Hold Water - 2

Fig. A Dredd Blog Zones
In this series I began by going over some of the basics about "the bathtub" model.

The mantra that signals usage of the bathtub model is the phrase "global mean average sea level rise."

A sea level expert explains: "By taking the [global] average you're assuming something, and you're assuming it implicitly. You're assuming what we call the bathtub model" (The Bathtub Model Doesn't Hold Water, quoting Dr. Jerry Mitrovica @31:14 of the video in that post).

The bathtub model is actually a cultural myth that damages comprehensive understanding of the real nature of sea level change (SLC).
Fig. 1

It is a meme bandied about by both those with and those without a substantial scientific foundation.

It is even bandied about by those who should understand it better (William L. Chameides is Dean of Duke University’s Nicholas School of the Environment).

That member of the warming commentariat, like way too many others, has yet to learn that gravity has a major part to play (The Gravity of Sea Level Change, 2, 3, 4).

Fig. 2
Or that a substantial but little known portion of SLC is sea level fall (SLF), which is caused by the loss of gravity when global warming melts ice sheets from above or from below (The Ghost-Water Constant, 2, 3, 4, 5, 6, 7).

That phenomenon has yet to be perfectly quantified even though it is a major player in SLC.

Anyway, I have been demonstrating the absurdity of the bath tub model by publishing graphs of Dredd Blog Zones (see Fig. A at the top-left of this post).

Those zones are very small areas (compared to the entire globe) where one can focus on the various and sundry differences of SLC by observing tide gauge station records.
Fig. 3

Recently, regular readers and I have been looking at 21 of those zones in terms of their basic structure.

That basic structure is individual tide gauge station records within those zones, but more than that, I used records begun in the 1800s.

Those 21 zones were presented in a recent post in that format, which looks like an explosion in a spaghetti factory.

So, today I have presented graphs of those 21 zones in a mean average presentation,
Fig. 4
rather than in the spaghetti code mode.

Regular readers can thereby see how global mean average glosses over the wild dynamics of actual reality SLC in global mean average scenarios.

Compare the following 21 zones that are presented in mean average mode with those 21 zones in single tide gauge records mode (yesterday's post is On The Natural Variability of Tide Gauge Records):
Fig. 1) Zone: AD.SW.SE, 38 stations, begin year: 1858

Fig. 2) Zone: AG.NE.SE, 31 stations, begin year: 1899
Fig. 5

Fig. 3) Zone: AG.SE.NE, 11 stations, begin year: 1855

Fig. 4) Zone: AH.NE.SE, 36 stations, begin year: 1897

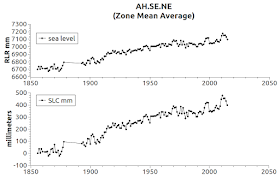
Fig. 5) Zone: AH.SE.NE, 31 stations, begin year: 1856

Fig. 6) Zone: AH.SE.SW, 29 stations, begin year: 1898

Fig. 7) Zone: AI.NE.NE, 35 stations, begin year: 1858

Fig. 8) Zone: AI.NE.SE, 32 stations, begin year: 1807

Fig. 6
Fig. 9) Zone: AI.SE.NE, 29 stations, begin year: 1882

Fig. 10) Zone: AI.SE.SE, 20 stations, begin year: 1881

Fig. 11) Zone: AJ.NW.NW, 54 stations, begin year: 1811

Fig. 12) Zone: AJ.NW.NE, 29 stations, begin year: 1858

Fig. 13) Zone: AJ.NW.SW, 33 stations, begin year: 1833

Fig. 14) Zone: AJ.SW.NW, 38 stations, begin year: 1884

Fig. 15) Zone: AJ.SE.NW, 6 stations, begin year: 1874
Fig. 7

Fig. 16) Zone: AL.SW.SW, 71 stations, begin year: 1894

Fig. 17) Zone: AQ.NW.NE, 3 stations, begin year: 1882

Fig. 18) Zone: AQ.NW.SW, 8 stations, begin year: 1878

Fig. 19) Zone: AQ.NW.SE, 9 stations, begin year: 1882

Fig. 20) Zone: A2.NE.NE, 4 stations, begin year: 1897

Fig. 21) Zone: A3.NE.NW, 10 stations, begin year: 1886
Each of those zones is represented in today's graphs, in terms of RLR mm, with a single
Fig. 8
graph line, and the actual SLC in millimeters is also a single graph line.

Yesterday's graphs of the same zones have one line for each tide gauge station SLC history in the particular zone being graphed.

In today's post, each tide gauge station's record is averaged into a zone mean average line, rather than having up to 71 lines for one graph.

The split frame view in today's graphs are the same mean average, it is just that the top line is a PSMSL RLR mm value, while the lower one is the actual SLC in millimeters, of the upper PSMSL RLR value line.

In other words, the subtraction has been done for you.

When an area is small like this, zone mean average is not as destructive to the understanding of what is going on as it is when the entire globe of the Earth is averaged into one value..

The remaining graphs:

Fig. 9

Fig. 10

Fig. 11

Fig. 12

Fig. 13

Fig. 14

Fig. 15

Fig. 16

Fig. 17

Fig. 18

Fig. 19

Fig. 20

Fig. 21


The next post in this series is here, the previous post in this series is here.


Monday, May 16, 2016

On The Natural Variability of Tide Gauge Records

Fig. 1 1st 24 Stations of 71
I. Background

This post wraps up the subject matter, for now, concerning Dredd Blog zones which contain more than one tide gauge station, and at least one tide gauge station that has been reporting sea level at that station since the 1800's.

These final graphs today complete the list of graphs for twenty-one zones which began to keep records over two centuries ago (209 years) in 1807.

II. The Twenty-One Zones Covered

In posts Zone AH, Quadrant SE, Subquadrant NE - 2, The Extinction of Robust Sea Ports - 5, The Warming Science Commentariat - 4, and today's post, twenty one zones were graphed.

Fig. 2 2nd 23 Stations of 71
The following list contains the zone id, number of stations in that zone, and the first year records began to be kept in that area.

Fig. 3 3rd 24 Stations of 71
1) Zone: AD.SW.SE, 38 stations, begin year: 1858 (Fig. 3 here)

2) Zone: AG.NE.SE, 31 stations, begin year: 1899 (Fig. 4 here)

3) Zone: AG.SE.NE, 11 stations, begin year: 1855 (Fig. 5 here)

Fig. 4
4) Zone: AH.NE.SE, 36 stations, begin year: 1897 (Fig. 6 here)

5) Zone: AH.SE.NE, 31 stations, begin year: 1856 (Fig. 1 here)

6) Zone: AH.SE.SW, 29 stations, begin year: 1898 (Fig. 6 here)

7) Zone: AI.NE.NE, 35 stations, begin year: 1858 (Fig. 8 here)

8) Zone: AI.NE.SE, 32 stations, begin year: 1807 (Fig. 8 here)

9) Zone: AI.SE.NE, 29 stations, begin year: 1882 (Fig. 10 here)

10) Zone: AI.SE.SE, 20 stations, begin year: 1881 (Fig. 11 here)

11) Zone: AJ.NW.NW, 54 stations, begin year: 1811 (Fig. 4)

Fig. 5
12) Zone: AJ.NW.NE, 29 stations, begin year: 1858 (Fig. 12 here)

13) Zone: AJ.NW.SW, 33 stations, begin year: 1833 (Fig. 6)

14) Zone: AJ.SW.NW, 38 stations, begin year: 1884 (Fig. 8)

15) Zone: AJ.SE.NW, 6 stations, begin year: 1874 (Fig. 7)

16) Zone: AL.SW.SW, 71 stations, begin year: 1894 (Fig. 1,2,3)

17) Zone: AQ.NW.NE, 3 stations, begin year: 1882 (Fig.9)

18) Zone: AQ.NW.SW, 8 stations, begin year: 1878 (Fig. 10)

Fig. 6
19) Zone: AQ.NW.SE, 9 stations, begin year: 1882 (Fig. 12)

20) Zone: A2.NE.NE, 4 stations, begin year: 1897 (Fig. 1 here)

21) Zone: A3.NE.NW, 10 stations, begin year: 1886 (Fig. 2 here)

III. Using Contrasting Records

There are many reasons for using the older tide gauge station records, and contrasting them with tide gauge records at stations built after them.

Fig. 7
These graphs, made from records in small zones bounded by latitudes and longitudes of a meaningful geographical nexus, mean more than the "global mean average."

Fig. 8
On several of the graphs you see small red and blue squares that mark the beginning of a record as well as the end.

This way the sea level rise or fall at any location is shown to have a different dynamic than those at other locations relatively near them.

This illustrates the point that sea level rise not only takes place at different rates at different locations, but also that tide gauge stations are better used in conjunction with those near them.

Fig. 9

IV. The Public Deserves The Truth

Dr. Jerry Mitrovica is one of the world's better experts on why the oceans fall and rise when ice sheets melt

In the first video below, he indicates that using the global mean average ("bathtub model") is not a clear picture of reality.

So, people have been kept from information to the degree that it diminishes their ability to better understand the circumstances in their geographical area.

Regular readers of Dredd Blog are part of the public, so I try to give them the reality of all this, warts and all.

Fig. 10
It is their right to figure out for themselves, their families, and their friends, how these events have meaning in their own personal lives.

Fig. 11
When they know the actual circumstances, they can at least call officials to find out what those officials are doing in response to the dangers to seaports and seashores in their geographical area.

V. Conclusion

Look over the graphs.

Notice how active the oceans are.

Imagine you are an official in a company that is being asked about moving a seaport to a new location.

Think about all the things in these records that will help you to figure out the better way to proceed.
Fig. 12

All the while remembering that you have been told only about the silly millimetres of sea level rise for decades.

Then think about what if it is too late now to adapt fast enough.

The scientist who was a post doctorate student along with Dr. Stephen Hawking, in the second video, talks about climate change and the growing difficulty of computer models during storms of change.