Pages

Thursday, July 29, 2021

Quantum Oceanography - 10

Fig. 1 Antarctica Sectors / Areas
In this series we are considering basic photon physics, and exploring it as it applies to the Oceanography that has not yet advanced into Quantum Oceanography:

"In physics, absorption of electromagnetic radiation is how matter (typically electrons bound in atoms) takes up a photon's energy — and so transforms electromagnetic energy into internal energy of the absorber (for example, thermal energy)".

(Wikipedia photon absorption, cf. Beer-Lambert law). Things will move along once researchers grasp the ghost photons and ghost plumes that heretofore, in grandfather's oceanography (for the most-part) evaded discovery (The Ghost Plumes, 2, 3, 4, 5, 6, 7, 8, 9, 10, 11, 12, 13, 14, 15; The Ghost Photons, 2, 3).

The oceans vary in quantity and type of quanta of their seawater, but for the most part (other than H2O), here is what they are made of:

The six most abundant ions of seawater are chloride (Cl), sodium (Na+), sulfate (SO24), magnesium (Mg2+), calcium (Ca2+), and potassium (K+). By weight these ions make up about 99 percent of all sea salts. The amount of these salts in a volume of seawater varies because of the addition or removal of water locally (e.g., through precipitation and evaporation). The salt content in seawater is indicated by salinity (S), which is defined as the amount of salt in grams dissolved in one kilogram of seawater and expressed in parts per thousand. Salinities in the open ocean have been observed to range from about 34 to 37 parts per thousand (0/00 or ppt), which may also be expressed as 34 to 37 practical salinity units (psu).


Chlorine (Cl), chemical element, the second lightest member of the halogen elements, or Group 17 (Group VIIa) of the periodic table. Chlorine is a toxic, corrosive, greenish yellow gas that is irritating to the eyes and to the respiratory system.


sodium (Na), chemical element of the alkali metal group (Group 1 [Ia]) of the periodic table. Sodium is a very soft silvery-white metal. Sodium is the most common alkali metal and the sixth most abundant element on Earth, comprising 2.8 percent of Earth’s crust. It occurs abundantly in nature in compounds, especially common salt—sodium chloride (NaCl)—which forms the mineral halite and constitutes about 80 percent of the dissolved constituents of seawater. [emphasis added]

Sulfate, also spelled Sulphate, any of numerous chemical compounds related to sulfuric acid, H2SO4. One group of these derivatives is composed of salts containing the sulfate ion, SO42-, and positively charged ions such as those of sodium, magnesium, or ammonium; a second group is composed of esters, in which the hydrogen atoms of sulfuric acid have been replaced by carbon-containing combining groups such as methyl (CH3) or ethyl (C2H5).

Magnesium is a chemical element with the symbol Mg and atomic number 12. It is a shiny gray solid which bears a close physical resemblance to the other five elements in the second column (group 2, or alkaline earth metals) of the periodic table: all group 2 elements have the same electron configuration in the outer electron shell and a similar crystal structure.

Calcium is a chemical element with the symbol Ca and atomic number 20. As an alkaline earth metal, calcium is a reactive metal that forms a dark oxide-nitride layer when exposed to air. Its physical and chemical properties are most similar to its heavier homologues strontium and barium. It is the fifth most abundant element in Earth's crust, and the third most abundant metal, after iron and aluminium. The most common calcium compound on Earth is calcium carbonate, found in limestone and the fossilised remnants of early sea life; gypsum, anhydrite, fluorite, and apatite are also sources of calcium. The name derives from Latin calx "lime", which was obtained from heating limestone.

Potassium is a chemical element with the symbol K (from Neo-Latin kalium) and atomic number 19. Potassium is a silvery-white metal that is soft enough to be cut with a knife with little force.[5] Potassium metal reacts rapidly with atmospheric oxygen to form flaky white potassium peroxide in only seconds of exposure. It was first isolated from potash, the ashes of plants, from which its name derives. In the periodic table, potassium is one of the alkali metals, all of which have a single valence electron in the outer electron shell, that is easily removed to create an ion with a positive charge – a cation, that combines with anions to form salts. Potassium in nature occurs only in ionic salts. Elemental potassium reacts vigorously with water, generating sufficient heat to ignite hydrogen emitted in the reaction, and burning with a lilac-colored flame. It is found dissolved in sea water (which is 0.04% potassium by weight[6][7]), and occurs in many minerals such as orthoclase, a common constituent of granites and other igneous rocks.[8]

(Seawater, Britannica). This raises the question, do the 'salinity' elements in seawater emit the infrared photons that melt glacial ice, or do the H2O molecules in seawater do it alone?

Fig. 2 'Heat' is infrared photons

Today's graphs are in appendices: Sector A, Sector B, Sector C, Sector D, Sector E, and Sector F (they may help answer the question).

These graphs concern different areas of Antarctica's glacial grounding lines (Fig. 1, Antarctica 2.0 - 11).

They indicate 'maybe both' (i.e. both the h2o molecules and the other 'salinity' molecules in seawater may all emit infrared photons which enter the glacial ice's h2o molecules and cause a heat increase until melting takes place, Fig. 2).

The next post in this series is here, the previous post in this series is here.

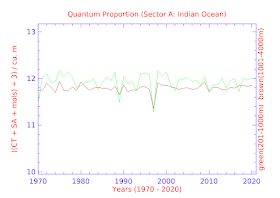
Appendix Sector A

This is an appendix to: Quantum Oceanography -10


The following graphs detail Conservative Temperature (CT), Absolute Salinity (SA), mol count per m3 of infrared photons emanating from seawater into glacial ice (causing melt), and the quantum proportion of those three values.

Due to varying currents, length of grounding lines, temperature, and salinity elements in the seawater, different sectors/areas of Antarctica have differing values, as shown on the graphs.


Appendix Sector B

This is an appendix to: Quantum Oceanography -10


The following graphs detail Conservative Temperature (CT), Absolute Salinity (SA), mol count per m3 of infrared photons emanating from seawater into glacial ice (causing melt), and the quantum proportion of those three values.

Due to varying currents, length of grounding lines, temperature, and salinity elements in the seawater, different sectors/areas of Antarctica have differing values, as shown on the graphs.


Appendix Sector C

This is an appendix to: Quantum Oceanography -10


The following graphs detail Conservative Temperature (CT), Absolute Salinity (SA), mol count per m3 of infrared photons emanating from seawater into glacial ice (causing melt), and the quantum proportion of those three values.

Due to varying currents, length of grounding lines, temperature, and salinity elements in the seawater, different sectors/areas of Antarctica have differing values, as shown on the graphs.


Appendix Sector D

This is an appendix to: Quantum Oceanography -10


The following graphs detail Conservative Temperature (CT), Absolute Salinity (SA), mol count per m3 of infrared photons emanating from seawater into glacial ice (causing melt), and the quantum proportion of those three values.

Due to varying currents, length of grounding lines, temperature, and salinity elements in the seawater, different sectors/areas of Antarctica have differing values, as shown on the graphs.


Appendix Sector E

This is an appendix to: Quantum Oceanography -10


The following graphs detail Conservative Temperature (CT), Absolute Salinity (SA), mol count per m3 of infrared photons emanating from seawater into glacial ice (causing melt), and the quantum proportion of those three values.

Due to varying currents, length of grounding lines, temperature, and salinity elements in the seawater, different sectors/areas of Antarctica have differing values, as shown on the graphs.


Appendix Sector F

This is an appendix to: Quantum Oceanography -10


The following graphs detail Conservative Temperature (CT), Absolute Salinity (SA), mol count per m3 of infrared photons emanating from seawater into glacial ice (causing melt), and the quantum proportion of those three values.

Due to varying currents, length of grounding lines, temperature, and salinity elements in the seawater, different sectors/areas of Antarctica have differing values, as shown on the graphs.


Monday, July 26, 2021

Congratulations To Bob Dylan - 3

This series expresses what many Dredd Blog readers understand (Congratulations To Bob Dylan, 2).

This one is special too, happy eighth decade:


The previous post in this series is here.
Quantum Oceanography - 9

Where da heat at?
In this series Dredd Blog has discussed the importance of considering the interaction of infrared photons in seawater with glacial ice at the grounding lines in Antarctica (Quantum Oceanography, 2, 3, 4, 5, 6, 7, 8).

Ice, including glacial ice at the grounding lines of glaciers in Antarctica, will absorb infrared photons at several wavelengths and energy levels (i.e. infrared photons from the seawater):

 "The interactions of electromagnetic radiation with ice ... are determined by the refractive index and absorption coefficient (the ‘optical constants’) of pure ice as functions of wavelength. Bulk ... absorptance ... [is] influenced [by] ... bubbles ... and brine inclusions ... The absorption spectrum of liquid water resembles that of ice ...The optical properties of ice ... are important for the energy budgets of ... infrared radiation, and therefore the climate, over large parts of the Earth’s surface." 

(Warren 2018, cf. Grundy 1988). This hints at the broad receptiveness which glacial ice has for seawater's infrared photons, whether they are emitted from the H2O elements or from the 'salinity' (SA) elements (Cl, Na+, SO24−, Mg2+, Ca2+, and K+) in seawater.

Since Antarctica has about 200 feet of sealevel change stored there as ice, watching the photon flow from the seawater into the ice is an important research activity. 

Especially now, since this is a timely moment for watching global heating spread deep and wide, according to several whispers about an upcoming IPCC report:

"Against a backdrop of fires and floods, researchers are meeting virtually to finalise a key climate science study. The Intergovernmental Panel on Climate Change (IPCC) is preparing the most comprehensive assessment on the state of global heating since 2013. Over the next two weeks, the scientists will go through their findings line by line with representatives of 195 governments.

Experts say the report will be a "wake-up call" to governments.

It is expected that the short, 40-page Summary for Policymakers will play an important role in guiding global leaders who will come to Glasgow in November to deal with critical climate questions."

(Yahoo News). Sounds ominous.

The 'spontaneous' part of the Second Law of Thermodynamics is something to focus on: The first statement of the 2nd law of thermodynamics - heat flows spontaneously from a hot to a cold body (Physics, cf. here).

The glacial ice is melted spontaneously, so we can't wait 16 years (Zero Years).

The next post in this series is here, the previous post in this series is here.


Grounding line news ... and ...